
Figures & data
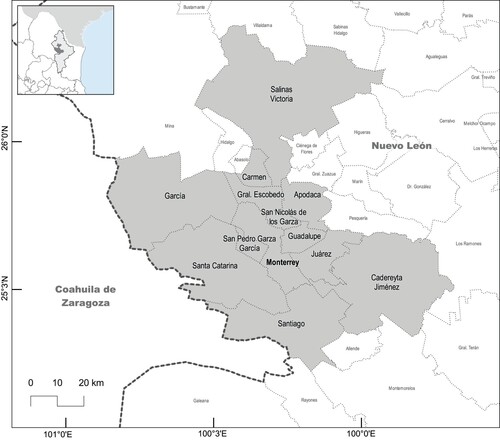
Map 1. Monterrey metropolitan zone. Location and Municipalities included in the metropolitan zone.
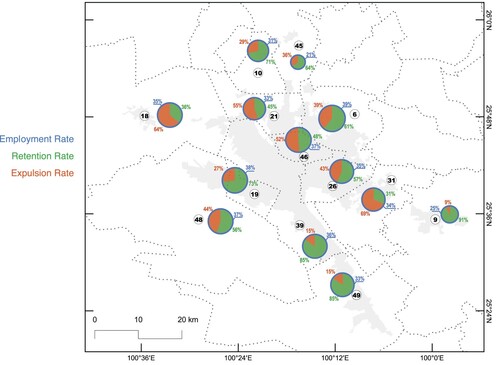
Map 2. Rates of retention and expulsion working women in the MMZ.
Map 3. Marital status. Women working outside their residential municipality. Range: 10–50%.
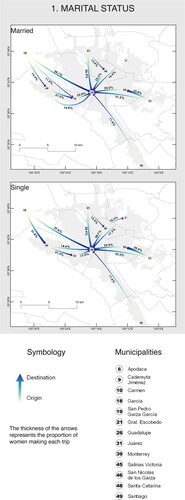
Table 1. Percentage of Retained (Ret) and Expulsion (Exp) working women (ww) by marital status, by municipality.
Table 2. Percentage of Retained (Ret) and Expulsion (Exp) working women (ww) by number of children, by municipality.
Map 4. Number of children. Women working outside their residential municipality. Range: 10–50%.
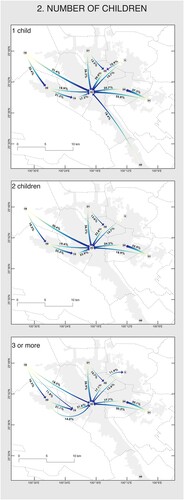
Table 3. Percentage of Retained (Ret) and Expulsion (Exp) working women (ww) by age of the youngest child, by municipality.
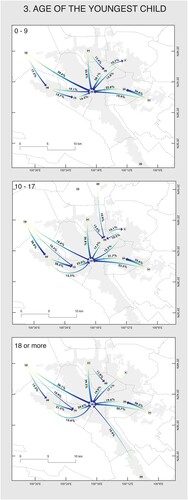
Map 5. Age of the youngest child. Women working outside their residential municipality. Range: 10–50%.
Map 6. Map of Monterrey Metropolitan Zone showing destinations who. relation to the head of the household. Women working outside their residential municipality. Range: 10–50%.
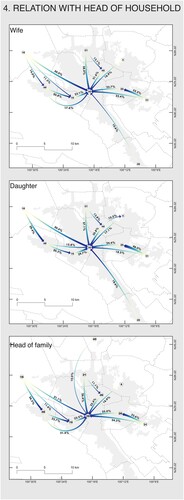
Table 4. Percentage of Retained (Ret) and Expulsion (Exp) working women (ww) by relation to the head of household, by municipality.
Supplemental Material
Download Zip (7.4 MB)Data availability statement
The data that support the findings of this study are openly available in Repositorio Tec: ‘Base de datos analizada. Muestra censal 2010’ at https://repositorio.tec.mx/handle/11285/641532.