
Figures & data
Figure 1. (a) Green and recreational land use. (b) Urban, commercial and industrial land use. (c) Schematic view of the eight historical zones of the Ruhr area (d) The location of the Ruhr area in Germany. Data source: Urban Atlas of the Copernicus Land Monitoring Service (Urban Atlas, Citation2019)
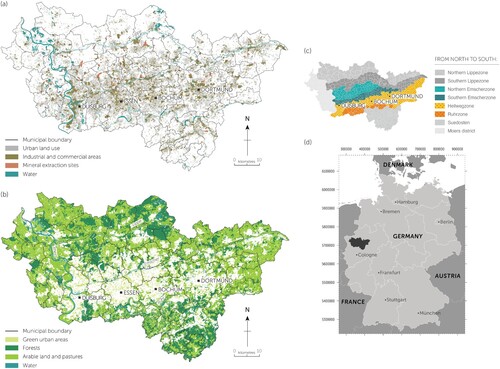
Figure 3. Distribution of the twenty-five socioeconomic SOM clusters over the Ruhr region
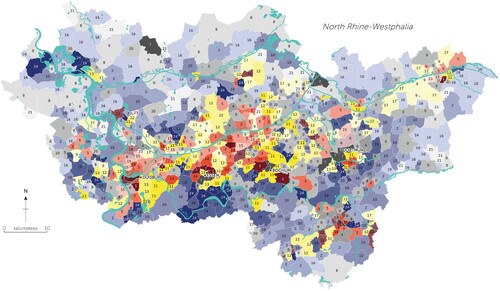
Figure 2. The ten SOM component maps. Values are defined as percentages (%) or indices ranging between 1 (very low) an 6 (very high). Data sources: (Microdialog, Citation2017; Zensus, Citation2011).
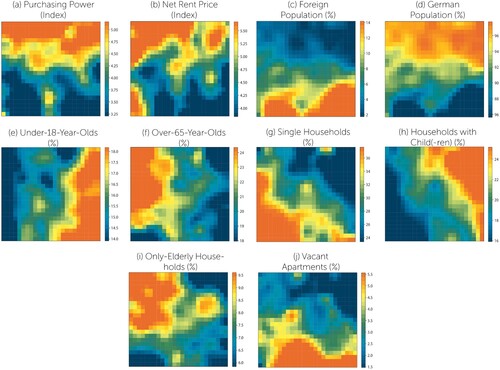
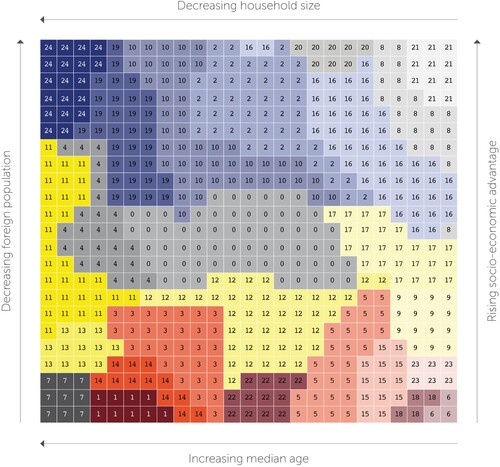
Figure 4. SOM Hit Map: Distribution of SOM clusters over the 2D model space.
Supplemental Material
Download Zip (38 MB)Data availability statement
To support our results and conclusions, we provide data containing the following parameters for each of the 732 neighbourhoods analysed in this article (in format): The x and y coordinates of the centroids (ETRS89 / UTM zone 32N), the SOM cluster-ID (ranging between 0 and 24, see and ) and we also indicate the city to which they belong (out of the total of 53 cities of the Ruhr Area). Moreover, we make the mean values of the ten variables () available for the twenty-five SOM clusters individually (as
). Since the German census of 100 × 100 metre resolution follows data protection guidelines (e.g. the precision of the information is reduced by not providing decimal places (Zensus, Citation2011)), a small error margin is to be expected when averaging for the whole metropolitan level.