
Figures & data
Figure 1. Satellite imagery (ESRI TerraColor NextGen) of the study area (red rectangle) and the location of satellite imageries in (black squares).
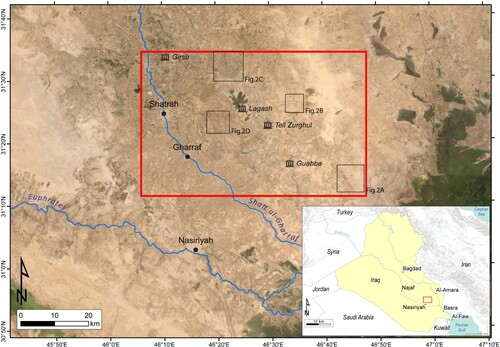
Figure 2. Satellite imageries (ESRI TerraColor NextGen) of inactive fluvial channels (A, B), active canals (C), and the active fluvial channels with the perpendicular herringbone pattern of the crops (D). In A, the black arrows point out the yellowish-brownish features of the inactive fluvial channels, while the red rectangles highlight the herringbone pattern of inactive canals. In B, the black lines point out the ridge-and-swale texture of the scroll bars.
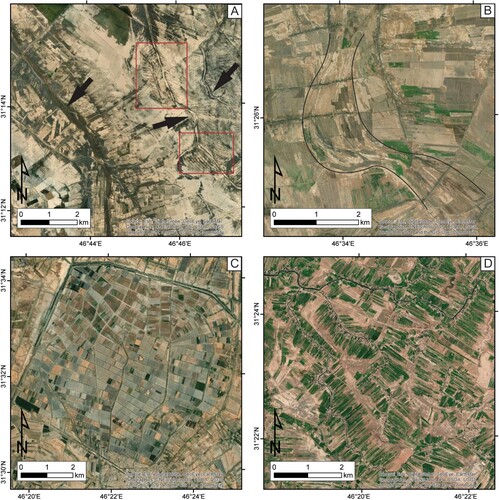
Figure 3. The multispectral indices NDVI and CR; the highest values of both indices are in the westernmost sector over the active Shatt al-Gharraf floodplain.
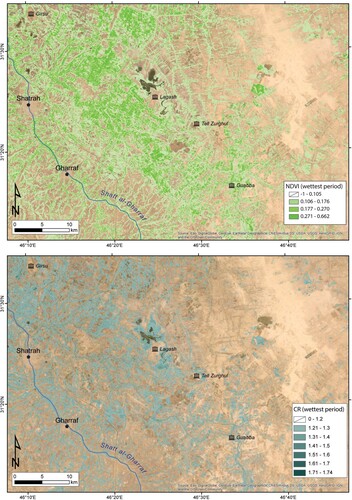
Figure 4. Satellite view (A) and AW3D30 DSM (B) where the altimetric profile has been constructed along an inactive crevasse splays on the right bank of the Shatt al-Gharraf. The modified crevasse channels (MCC) are higher than the inactive crevasse channels (ICC).
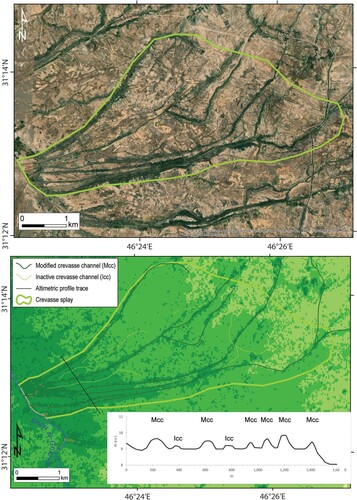
Figure 5. The irrigation canals mapped with red lines partially overlap the inactive fluvial channels traced by black dotted lines.
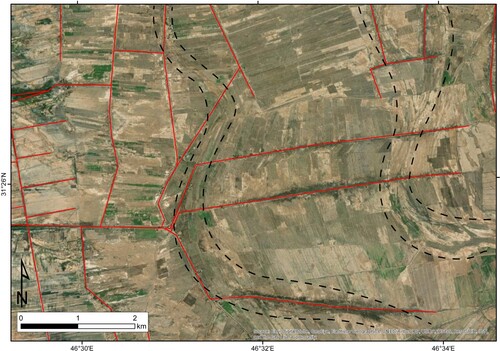
Figure 6. The UAV orthophoto of Tell Zurghul archaeological site acquired on 2017 (MAIN© Missione Archeologica Italiana a Nigin).
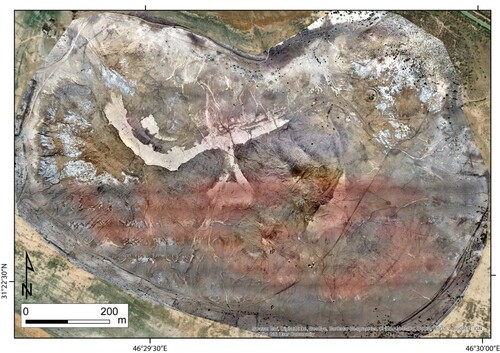
Figure 7. Natural-color images acquired by MODIS instruments carried by Terra and Aqua Satellites. Severe dust storms over Iraqi territory dated on 16 May 2022 (A) and 31 October 2017 (B). Images available online at NASA Earth Observatory (Citationn.a.) website (https://earthobservatory.nasa.gov/images)

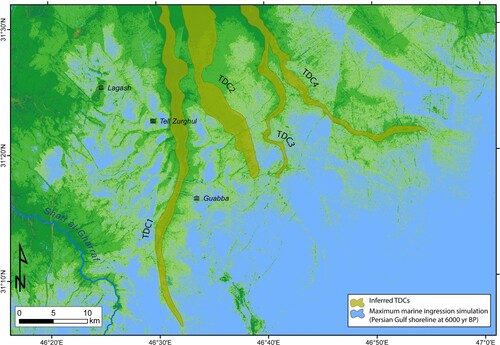
Figure 8. The AW3D30 reclassification where the four main TDCs of the study area are recognized and mapped.
Supplemental Material
Download Zip (9.2 MB)Data availability statement
The data that support the findings of this study are available from the corresponding author, Iacobucci G., upon reasonable request.