
Figures & data
Figure 1. Simplified geological map of the Ar-Hötöl section of the Khovd fault and neighboring area modified from the Geological Map of Mongolia at a scale of 1:500000 (CitationTomurtogoo et al., 1998). Quaternary faults are from CitationByamba (2009). The Ar-Hötöl surface rupture is from this study. See main text for description.
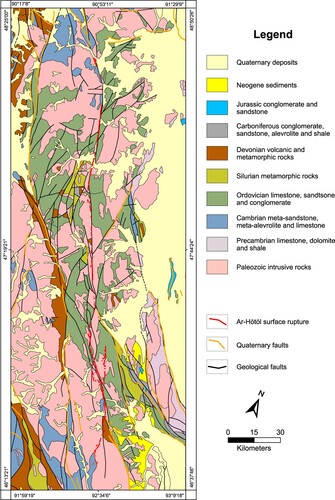
Figure 2. Fault zone complexity at the Ulaan Bulagt Mountain relay zone. (a) Pleiades panchromatic orthoimage. (b) Surface rupture map (red lines) along with documented offset markers (yellow dots). Circled numbers (3, 4 and 5) and letter (D) point to field pictures and a very high-resolution DEM visible in the Main Map. See Main Map for location.
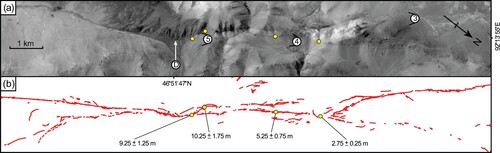
Figure 3. Fault junction at Höh Öndör Mountain. (a) TanDEM-X shaded relief with resolution of 12 m. The red lines show the southernmost termination of the Ar-Hötöl surface rupture as it reaches Höh Öndör Mountain and runs along the west flank of the mountain. The eastern splay dies out a few kilometers SE of the junction. The orange lines represent Quaternary faults. The yellow dots are documented offsets. (b) Close-up of the junction on Pleiades images with 0.5 m of resolution showing the complexity and distribution of the deformation. See Main Map for location.
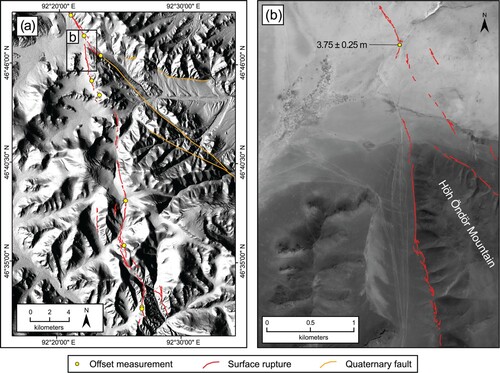
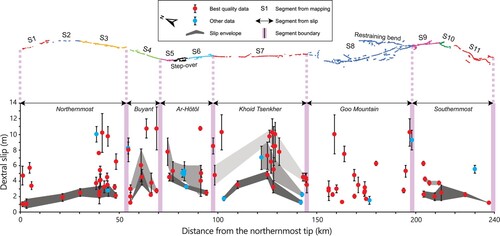
Figure 4. Segmentation from surface rupture map and dextral slip distribution of the Ar-Hötöl surface rupture. The color surface rupture map is divided into 11 segments (S1 to S11) based on changes in strike, deformation distribution and geometric complexity (see text for details). A second segmentation model (double-headed black arrows) comprises 6 segments and is based on our analysis of the slip distribution (lower panel). There, we retain slip values lower than 10 m of medium and high quality (red dots) and low quality (blue dots). We connect the lower individual values to build a slip envelope for the most recent event (dark grey) as well as cumulative slip envelopes that include the penultimate event (medium grey) and the antepenultimate event (light grey).
Supplemental Material
Download Zip (58.1 MB)Data availability statement
The original dataset containing the detailed map in vector format as well as a table of offset data are available on the Zenodo platform (CitationDavaasambuu et al., 2022).