
Figures & data
Figure 1. The location of Quinhagak within the Y-K Delta.
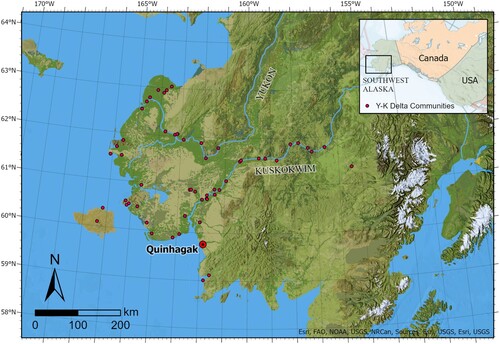
Figure 2. An aerial photo of Quinhagak viewed from the Bering Sea.
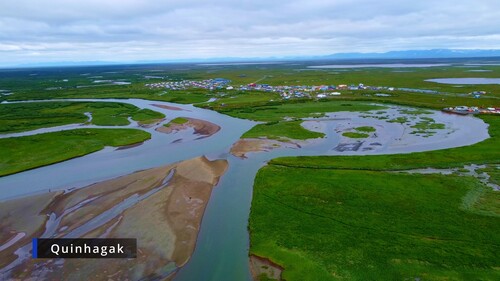
Figure 3. The extents of two maps depicting Quinhagak’s Traditional Land Use Area (TLUA). Such maps were used during interviews with local Yupiit to locate traditional place names, contemporary subsistence sites, and areas of high erosion.
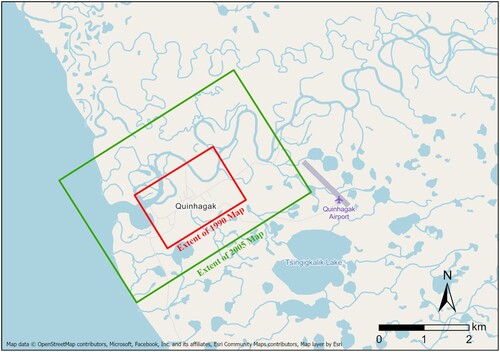
Figure 4. The total area of each river system within Quinhagak’s Traditional Land Use Area.
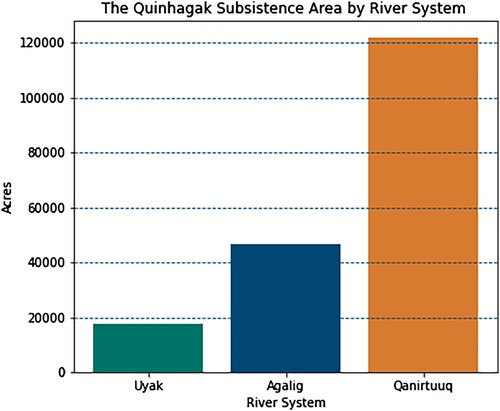
Figure 5. Erosion rates at the City dock and Kuiggacuk. Today, fish racks and modern homes have been relocated as the Qanirtuuq migrates south.
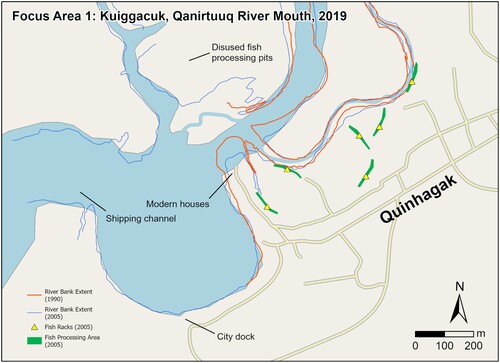
Figure 6. A 2022 map detailing areas where village infrastructure has been lost due to erosion.
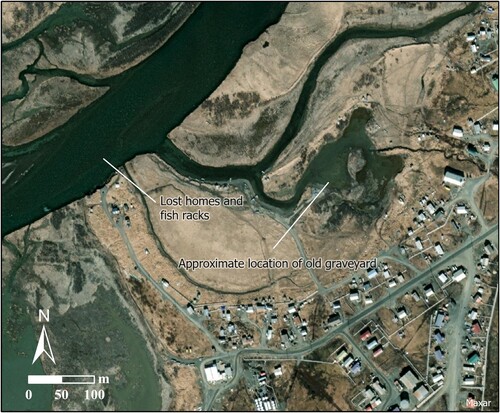
Table 1. A description of the GIS database we have produced since 2019 alongside the Qanirtuuq Land Manager’s office. From this database a subset of GIS layers were used for the 3 traditional place names included within the study area. Alt Text: [11 words] A summary statistics table of the GIS database constructed for this project.
Table 2. Rates of erosion of the Qanirtuuq near Quinhagak.
Figure 7. Meqsarturyaraq is a traditional place name near the old Airport in Quinhagak. It has traditionally been used as a boat dock, fresh water access, and fish processing/drying area. Furthermore, its location near berry patches that are close to the village make it an important cultural resource.
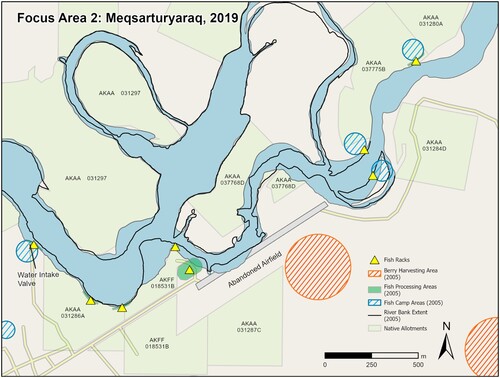
Figure 8. 2021 estimates of erosion damages for Quinhagak during the next century. Note the lack of erosion damages for village infrastructure until 2056, and the costs per lost fish camp (300,000). Image courtesy of the Alaskan Department of Natural Resources.
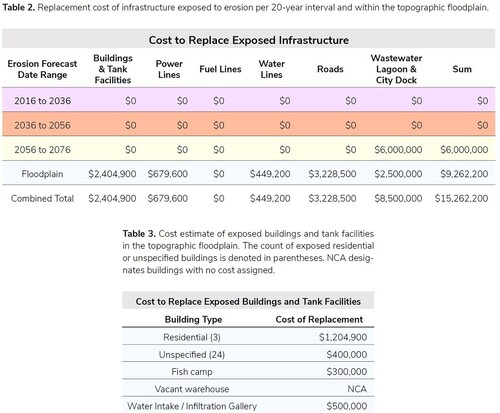
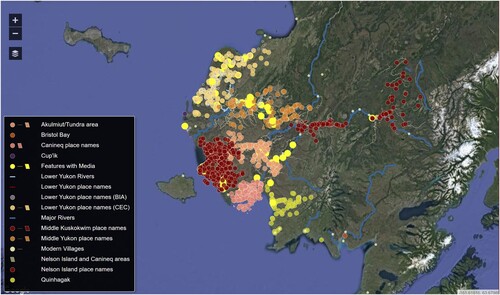
Figure 9. A sample distribution of Yup’ik subsistence place names throughout the Y-K Delta. Image courtesy of the EKOLA environmental Atlas.
Supplemental Material
Download Zip (6 MB)Data Availability Statement
The data that support the findings of this study are available from Qanirtuuq Inc, a registered ANCSA 14(h) village corporation in Quinhagak, AK. Restrictions apply to the availability of these data, which were used under license for this study. Data are available from Warren Jones with the permission of Qanirtuuq Inc.