
Figures & data
Figure 1. A: The study area is located in the southeastern Tibetan Plateau and the distribution of glaciers of Tibetan Plateau. The elevation data is extracted from GTOPO30 (USGS, Citation1997) B: The Hailuogou Glacier, southeastern Tibetan Plateau and the monitored sector of the glacier tongue. The background image is the false color composite of Sentinel 2A on the 10th November 2020. The Hailuogou Glacier outline and the distribution of glaciers in the Tibetan Plateau is from the Second Glacier Inventory Dataset of China version 1 (Guo et al., Citation2015).
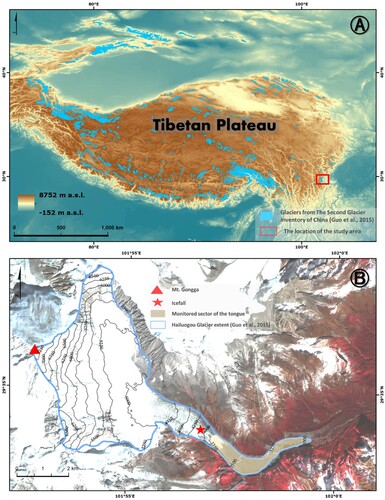
Figure 2. A: The icefall with elevation differences of ∼1080 m (image date: July 2021). Areas marked with red boxes are the exposed bedrocks due to the intense ablations. B: The viewing in the middle section of the glacier (∼3250 m a.s.l.). The glacier surface is covered by debris-mantle and intensively crevassed (image date: July 2021). C: The scene from the old viewing platform (∼ 3180 m a.s.l.). The glacier surface is highly debris-covered. Several long ice cliffs were exposed, and a highly crevassed lateral margin induced by external stream can be seen (image date: July 2021). D: The highly crevassed glacier terminus with frontal ice collapsing, and the proglacial river flows from the subglacial channel outlet (image date: July 2021). Blue arrows indicate the external streams flow into the glacier lateral margin from higher elevation (e.g. fed by tributary small glaciers).
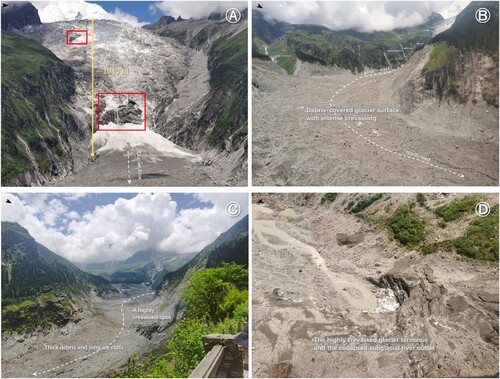
Figure 3. The spatial coverage of four UAV mapping areas and their elevation ranges, the distribution of the tie-points, the flight pathways, and the locations of three launch sites. The background image is the same as in .
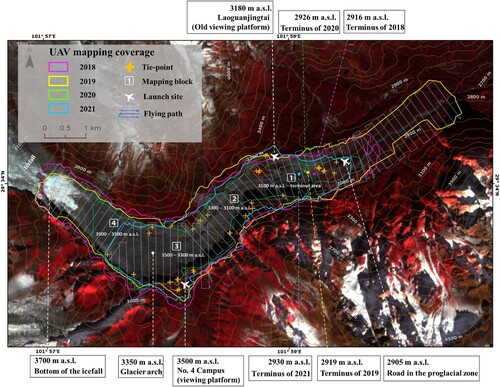
Figure 4. Workflow of UAV image processing was applied to datasets of 2018, 2019, 2020 and 2021 to derive the DSMs and orthophoto mosaics. Tie-points were extracted from the datasets of 2021 and then used for co-registering with 2018, 2019 and 2020 datasets.
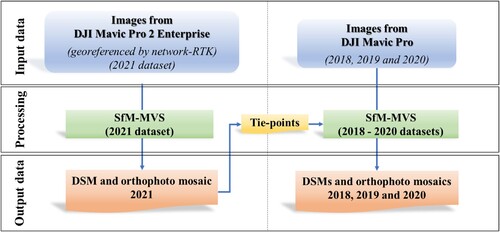
Figure 5. Visual identification of features in the Hailuogou Glacier valley.
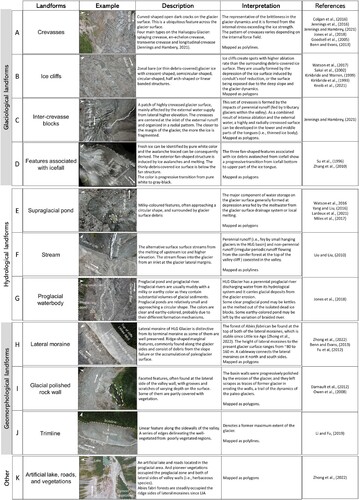
Figure 6. The ratio of each aspect (eight directions) of the ice cliffs in each sector. The center map shows the spatial distribution of the four elevation sectors. Please refer to S-Table 7 for detailed statistics of ice cliff orientations.
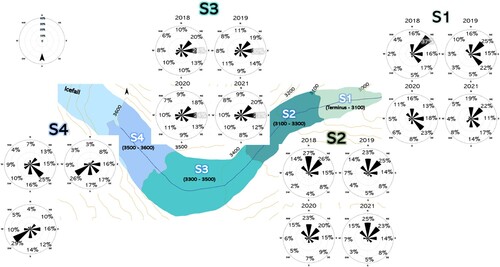
Figure 7. A: The annual area changes for each elevation sectors. B: Ice surface elevation along the glacier center flow line. C: Crevasse densities for four elevation sectors. D: Ice cliff densities for four elevation sectors.
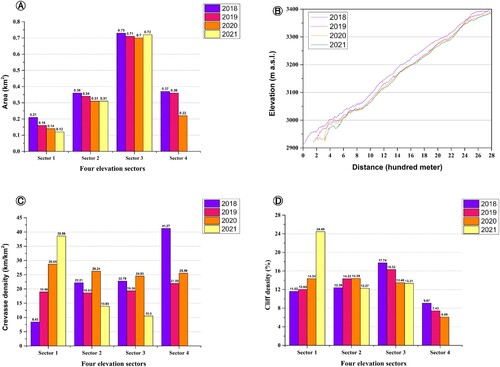
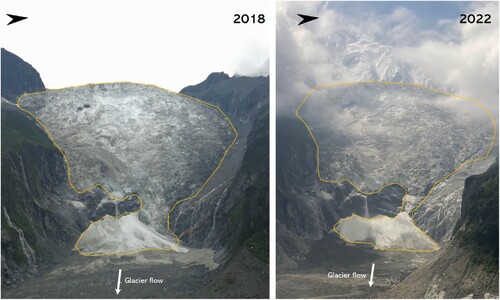
Figure 8. A comparison of Hailuogou Glacier icefall between 2018 and 2022.
Supplemental Material
Download Zip (128.9 MB)Data availability statement
The data that support the findings of this study are available from the corresponding author, Ping Fu, upon reasonable request.