
Figures & data
Figure 1. Simplified chronology of the Late/Final glacial and Early Holocene cultural development. Only phases and cultural groups evaluated in this paper are presented (graph B. Gehlen).
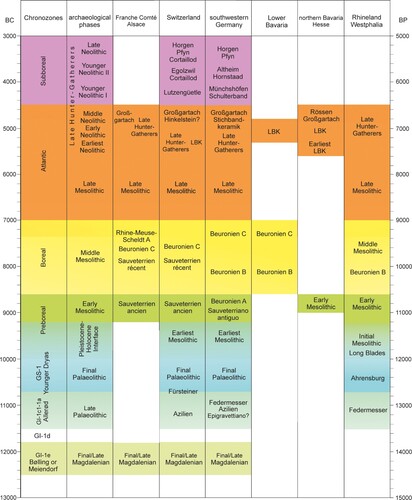
Figure 2. Boxplots for the polygon sizes of the Palaeolithic sites and those from the Pleistocene-Holocene Interface. The differences in the areas of all Palaeolithic phases and the transition are not statistically significant (Kruskal–Wallis-test, p = 0.4409). The differences between the southern and the western working area, however, are significant (Kruskal–Wallis-test, p = 0.03096) (Graph Frank Siegmund).
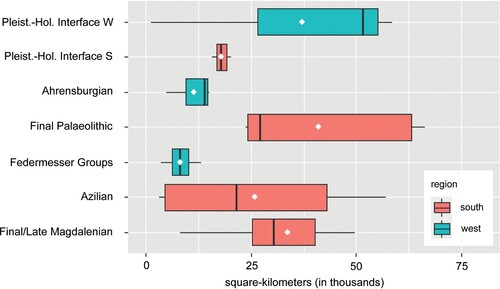
Figure 3. Boxplots for the polygon sizes of the Mesolithic sites. The differences are statistically significant (Kruskal–Wallis-Test, p = 0.00108) (Graph Frank Siegmund).
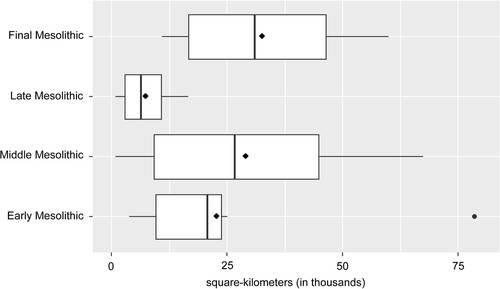
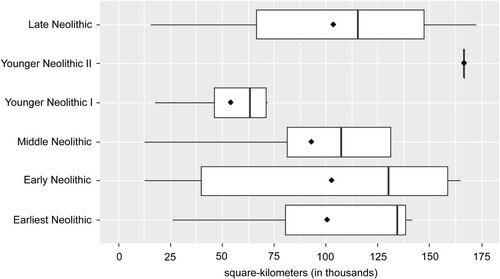
Figure 4. Boxplots for the polygon sizes of the Neolithic sites. The differences are statistically significant (Kruskal–Wallis-Test, p = 0.00427) (Graph Frank Siegmund).
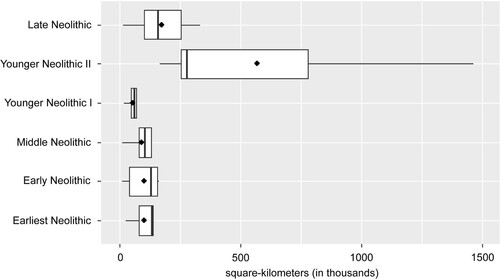
Figure 5. Boxplots for the polygon sizes of the Neolithic sites without the one for the Younger Neolithic II to illustrate the dimensions of the other phases more clearly (Graph Frank Siegmund).
Supplemental Material
Download Zip (23.4 MB)Data availability statement
Three appendices with the basic data and references for this research can be downloaded from https://uni-koeln.sciebo.de/s/3J255fYBK7dNMTq
Appendix 1a: Inventories with coordinates and relevant information on dating, sample size and basic literature; 1b: References Appendix 1.
Appendix 2: Location of raw material sources with information on geological age and use during the Stone Age periods.
Appendix 3: Descriptive Statistics and results of statistical testing for the created box plots () using R 4.2.1 (CitationR Core Team, 2022).
The data for all sites with their raw material sources and the mapped polygons will be published in an open-access repository after the ‘Paleomaps’-Volume has been printed.