


Figures & data
Figure 1. Research area and published studies. (a) Study area indicated by box west of the Gran Campo Nevado, located ca. 130 km south of the Campo de Hielo Patagónico Sur. (b) Mapped area includes overlap rectangles of locations studied previously. Solid black symbols correspond to marine sediment records (MSR), hollow symbols indicate lake sediments cores (LS), CitationBiester et al. (Citation2002) utilize peat records (PR), CitationLamy et al. (Citation2010) include MSR, LS and PR data while CitationSchimpf et al. (Citation2011) use cave and stalagmites samples (CS). Blue squares indicate the closest automatic weather stations.
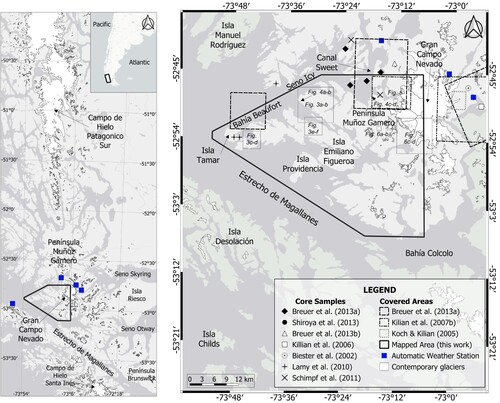
Figure 2. Spatial coverage of imagery used for geomorphological mapping. Planet satellite orthorectified images (Imagery © 2019 Planet Labs Inc.) form the base-map. Mosaics from these satellite images and from Sentinel-2 images cover the entire mapped area so are not indicated. The UAV footage area represents total area visualized during the flight. Colored hillshade of 45° is from ALOS PALSAR DEM and delimits the mapped area. Selected codes from the DGA inventory provided for Gran Campo Nevado glaciers (see Table S1). Islands mentioned in the text are labeled with numbers: 1: Isla Tamar (∼10 km2), 2: Isla Emiliano Figueroa (∼170 km2), 3: Isla Providencia (∼25 km2), 4: Isla Eleodoro (∼8 km2), 5: Isla Merino (∼11 km2).
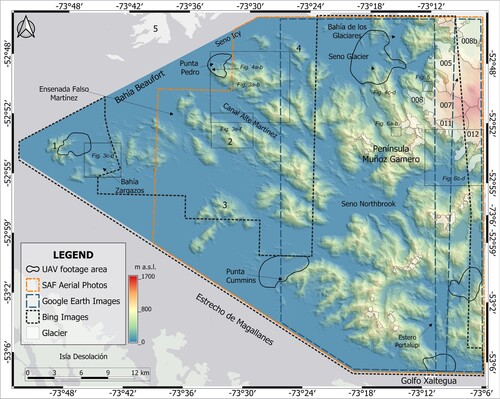
Table 1. Remote sensing data used.
Figure 3. Examples of erosional landforms mapped (see and for location): (a) Hillshade from ALOS PALSAR DEM illuminated from northwest showing glacial cirques in the area close to Punta Pedro. (b) Map of coalescing cirques and arêtes, with a tarn at the base of the most north-eastern cirque. Lakes are shown in blue. (c) Infrared Sentinel image showing eroded bedrock as a gray surface. (d) Interpreted whalebacks (continuous line) and roche moutonnées (dashed line). Ice flow from east to west, selected landform long profiles shown in meters (not to scale). Profiles 1 and 2 show asymmetric cross profile with smooth stoss and steep lee side, whilst profile 3 is symmetric. (e) Planet image showing the clearest asymmetric roche moutonnée example in Falso Martinez Valley. (f) Same location as image 3e with hillshade. Ice flow from SE to NW, long profile of rouche moutonnée plotted in meters (not to scale).
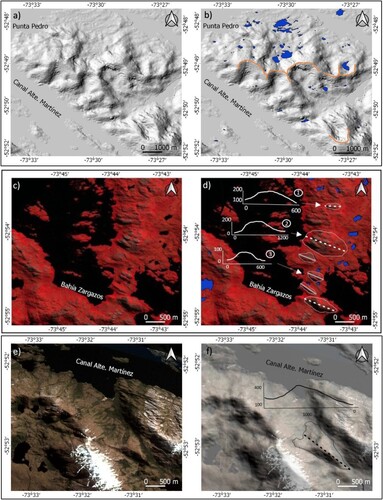
Figure 4. Examples of whalebacks mapped in the field (see for locations). (a) Micro-scale whaleback at Seno Icy. (b) Micro-scale fractured whaleback at Isla Tamar. (c,d) Back and side view of a meso-scale whaleback colonized by vegetation on its stoss side, image captured during a UAV flight at Seno Glaciar.
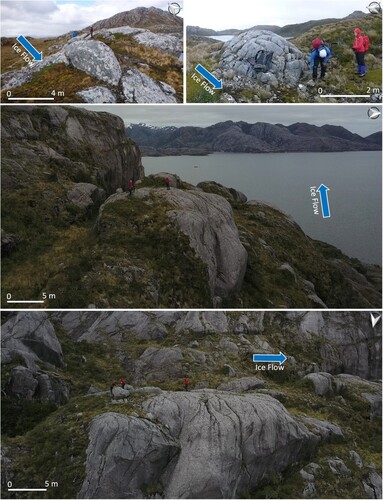
Table 2. Identification criteria for landforms mapped from satellite/aerial imagery.
Figure 5. Bing Satellite Image (2019) over ALOS PALSAR DEM view in 3D, east of Seno Glaciar. The terminus of glacier 007 is at ∼160 m a.s.l. (DEM elevation). Glacial meltwater is actively flowing 600 m down valley before producing a well-developed outwash plane. Northeast of Glacier 007, a frozen lake is at ∼485 m a.s.l. and a GLOF deposit is located downhill. Scoured bedrock is observed as gray polished surfaces in the whole area.
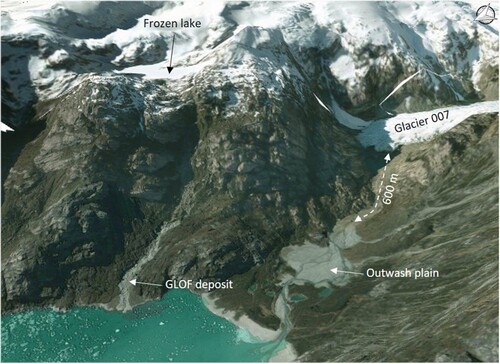
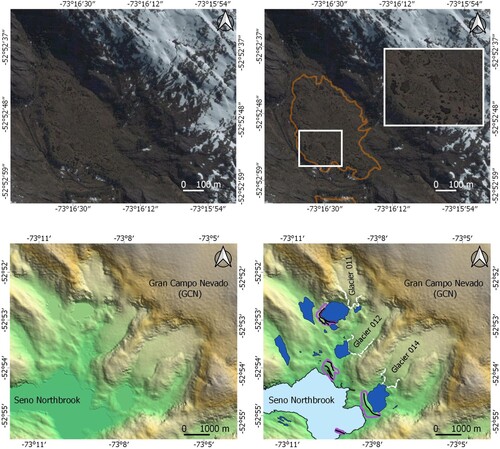
Figure 6. Examples of depositional landforms. (a) High-resolution GI image north of Seno Northbrook showing spotted deposits. (b) PI image showing same site as (a) with area of kettle kame topography delimited (full line). (c) Hillshade from DEM ALOS PALSAR illuminated from 45°, south–west GCN (see for location). (d) Mapping output of (c) site. Moraine area indicated with purple hollow polygons, respective moraine crests in black lines. More than one crest inside a polygon indicates a moraine complex. Lakes in blue and glacier margins in stippled white line (see Table S1).
Supplemental Material
Download PDF (154 MB)Supplemental Material
Download PDF (772.5 KB)Data availability statement
The data that support the findings of this study are available from the Glasgow University online repository at the following link: https://dx.doi.org/10.5525/gla.researchdata.1384. The primary data has the following license: CC-BY-SA. See supplemental materials for further information.