
Figures & data
Figure 1. Location map of the study area and the Molise region, produced with 5 m/px digital elevation model (DEM) superposed on Molise hillshade.
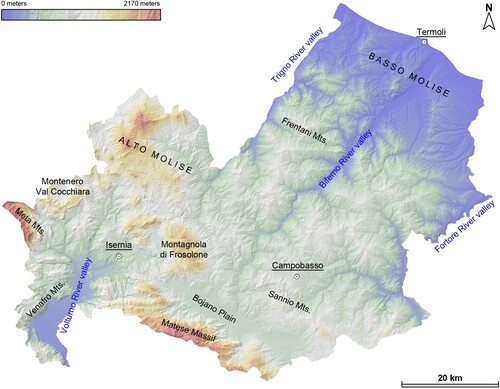
Figure 2. Paleogeographic domains of central and southern Apennines including the Molise area (redrawn from CitationVezzani et al., 2010).
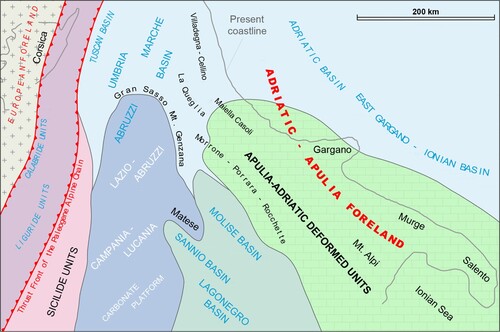
Figure 3. Examples of different types of DSGSDs mapped in Molise region (for location see the Inventory map): (a) sackung at Mt. Patalecchia (ID: 56), in the NW sector of Matese Massif; (b) sackung at Mt. Pietrereie (ID: 44), in the SW sector of Montagnola di Frosolone; (c) lateral spreading at Mt. Pizzi (ID: 46), in the Alto Molise sector; (d) rock mass spreading at Mt. Rocchetta (ID: 13), in the eastern sector of Meta Mts.; (e) complex type mechanism at Mt. Matese (ID: 74), along the NE margin of Matese Massif. All the images were produced with Google Earth.
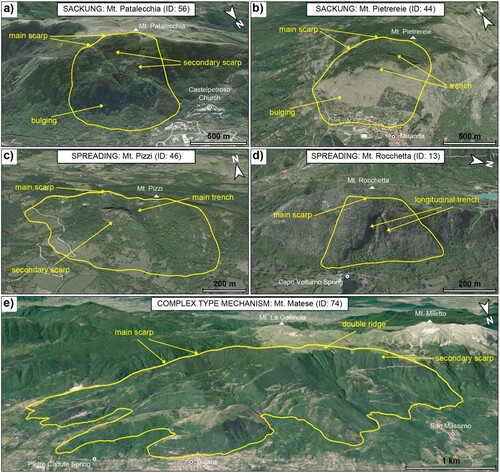
Figure 4. Line of Sight (LoS) mean displacement rate maps: (a) ERS ascending; (b) ERS descending; (c) ENVISAT ascending; (d) ENVISAT descending; COSMO-SkyMed ascending; (f) COSMO-SkyMed descending.
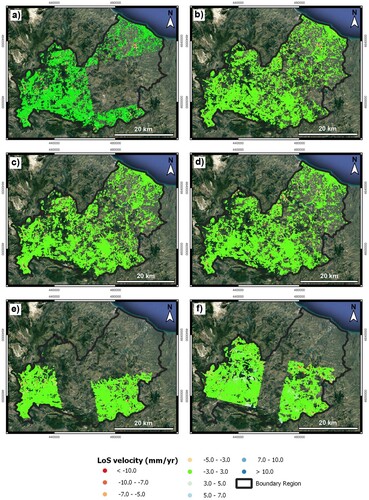
Figure 5. Statistical distribution of DSGSDs in relation to lithological units. (A) Undifferentiated marine, transitional, and continental Quaternary deposits; (B) Sands, gravels, and conglomerates, with intercalations of calcarenites, sandstones, and micro-conglomerates; (C) Clays, silty clays, marls, and sands, with intercalations of sandstones, conglomerates, calcarenites, and gypsum; (D) Varicolored clays, silty clays, and marly clays, with olistoliths and intercalations of marls, limestones, and radiolaritis; (E) Marls, calcarenites, and calcilutites, with intercalations of clays, marly clays, calcirudites, and marly limestones; (F) Calcirudites and calcarenites, with intercalations of conglomerates and marly limestones; (G) Calcilutites, micritic limestones, and dolostones; detritic limestones, cherty limestones, and marly limestones.
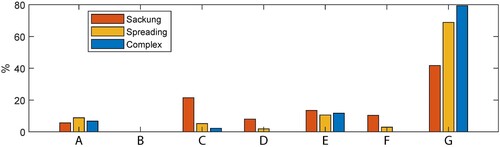
Figure 6. Boxplots derived for the morphometric variables of DSGSDs. The bar plot is shown for aspect factor.
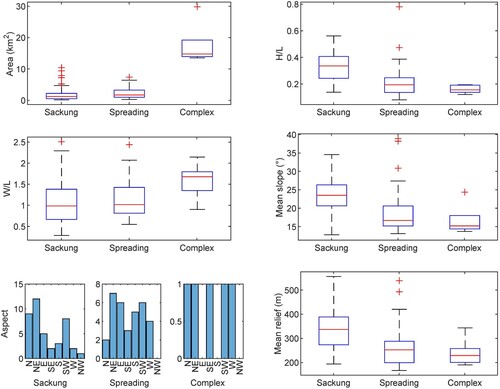
Table 1. Morphometric statistical variables of Molise DSGSDs.
Figure 7. Plot matrix derived for the morphometric variables of DSGSDs. The analyses were conducted considering the three types of slope deformations mapped in the study area.
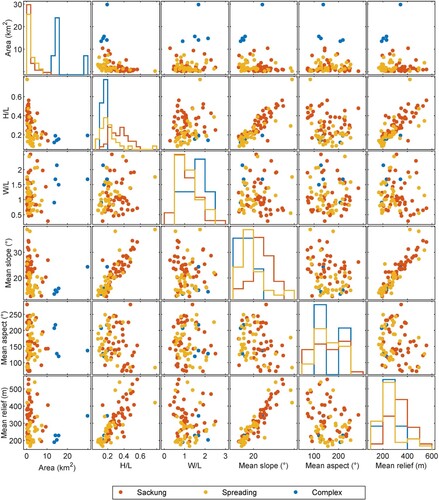
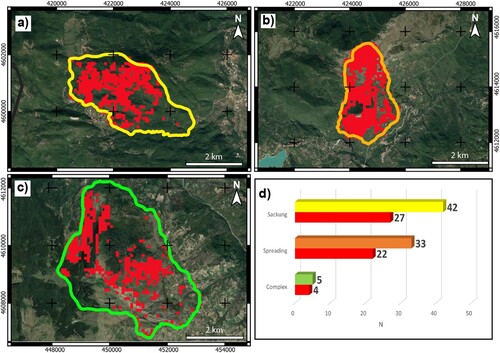
Figure 8. Anomalous areas identified within the different types of DSGSDs: (a) sackung; (b) spreading; (c) complex type mechanism; (d) histogram of the distributions of the different types and number of DSGSDs identified by anomalous areas; the red bars indicate ongoing/active phenomena.
Supplemental Material
Download Zip (42.2 MB)Data availability statement
The inventory of ‘Deep-Seated Gravitational Slope Deformations (DSGSDs) and main geomorphological features of Molise region (Italy)’ is stored at the link https://doi.org/10.5281/zenodo.7445688. Moreover, a web-GIS version of the database can be found at the Centro di ricerca, previsione e controllo dei rischi geologici (CERI) website https://gdb.ceri.uniroma1.it/index.php/view/.
Acknowledgments
The authors thank Geoservizi srl for the data and information provided. This study is part of the research project ‘Integrated analysis and hazard-oriented modeling of large-scale slope instabilities featured by Mass Rock Creep’ (scientific responsible Carlo Esposito) funded by Sapienza University of Rome. The Authors gratefully acknowledge the Editors Mike J. Smith and Chi-Wen Chen, and the reviewers Samuele Segoni, Su-Min Shen, and Cecilia Furlan for their suggestions that improved the manuscript.