Figures & data
Figure 1. Seismic events Mw > 5 from 1819 to 2006 with principal stress directions in the Kachchh basin.
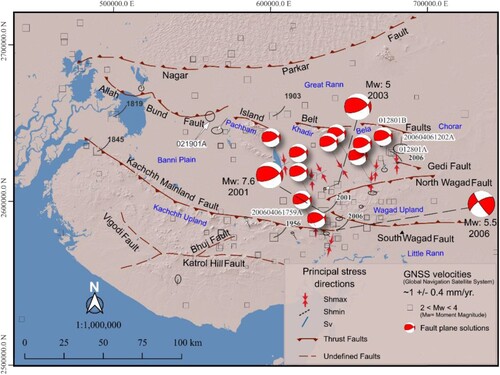
Figure 2. Harrapan archaeological sites and paleo-shoreline in the Holocene period. The dotted black line represents the shoreline proposed by Siveright (1907). The white dotted line represents the CitationGaur and Vora (1999) shoreline deciphered from the positioning of the Harrapan sites during the Middle to Late Holocene. Present-day tidal incursion limits in Kachchh have been derived from the MNDWI indices from LANDSAT-8 data (https://earthexplorer.usgs.gov/.).
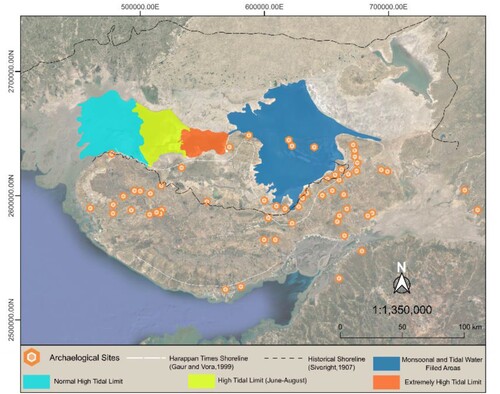
Figure 3. (a) Locations of the literature study area around the Kachchh basin. (b) Sea level curve of the W-India. Colour-coded triangles show age constraints collected from the literature.
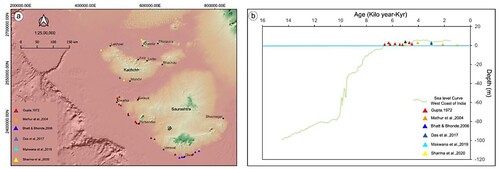
Figure 4. The methodology was organized as follows: high-resolution satellite mapping, digitization of historical maps and archaeological sites, validation through field surveys, and identification of markers for the evolution of landforms.
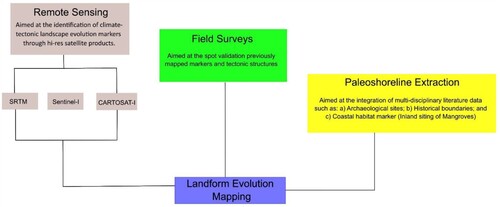
Figure 5. Landforms in the KU. (a) panoramic view of Kaswali river, (b) Knickpoint in the Lothia river, (c) degraded fault scarp near Lodai, (d) syncline depression between the younger anticline domes in the eastern extremity of NHR, (e) multiple terrace levels of Kaila river, (f) hanging pediment near Khari river, (g) depleted mangroves near the toe of the Lodai fan, and (h) small canyon in the Habo dome carved by a seasonal river.
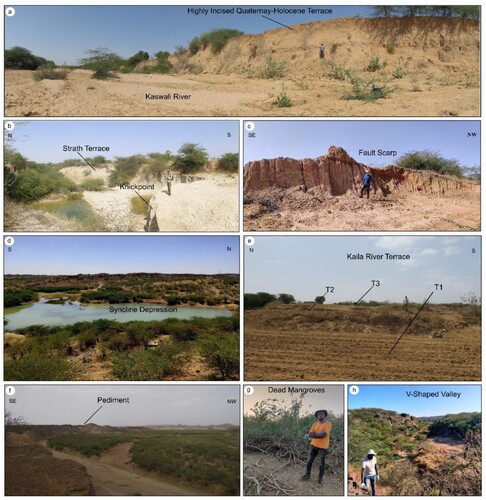
Figure 6. The transverse and longitudinal swath profiles depicting the topographic relief distribution along and across the NHR.
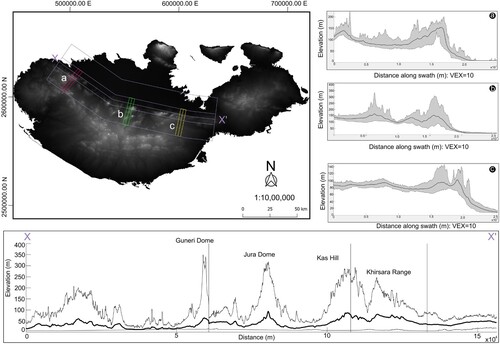
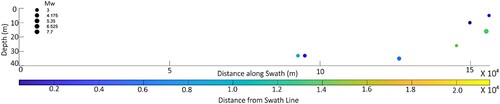
Figure 7. Swath-section, along the X-X’ swath profile shown in , depicting the hypocenters from the revised literature. Circles represent the hypocenters of seismic events in the Kachchh Basin collected in a 40 km width swath and plotted along the cross-section. The colour code represents the distance from the swath baseline, and the circle's size represents the event's magnitude.