
Figures & data
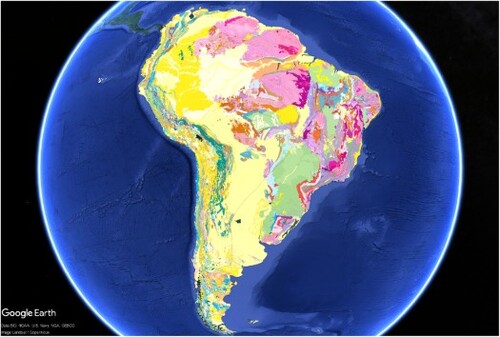
Figure 1. Chronolithostratigraphic units of the Geological Map of South America 2019 (modified from CitationGómez et al., 2019).
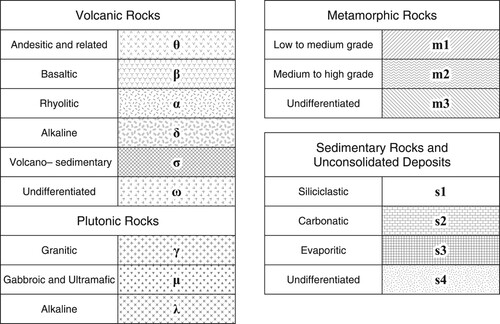
Figure 2. The 5th–7th zoom levels showing tile grids used to generate imaging of the Geological Map of South America 2019 in Google Earth.
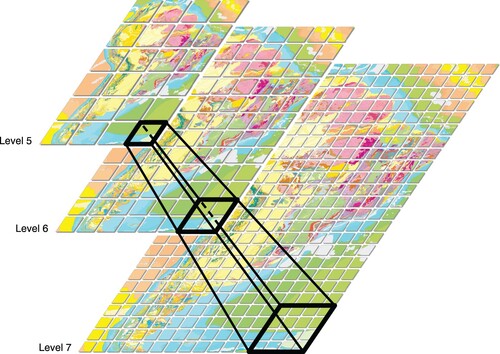
Figure 3. Example of tiles obtained by using QGIS.
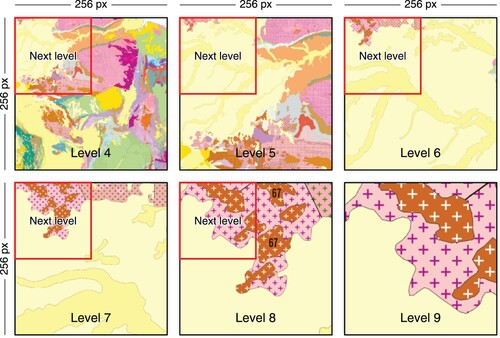
Figure 4. Xtensible Style Languaje script template fragment with updated URLs.
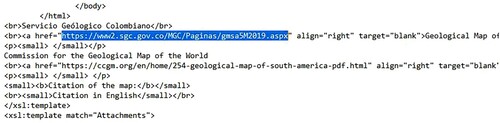
Figure 5. Geological map of South America 2019 displayed in Google Earth.
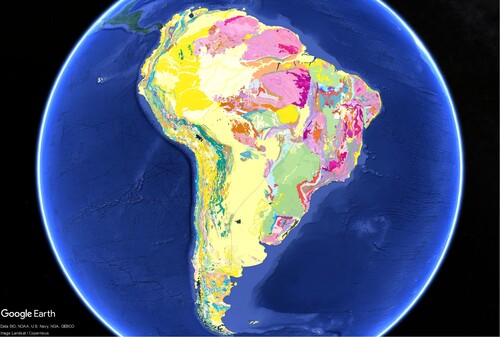
Figure 6. View of the geological map of South America 2019 in Google Earth showing an example of a pop-up window with a Cretaceous volcanic rock information.
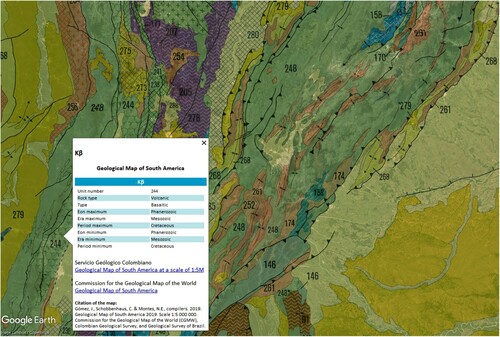
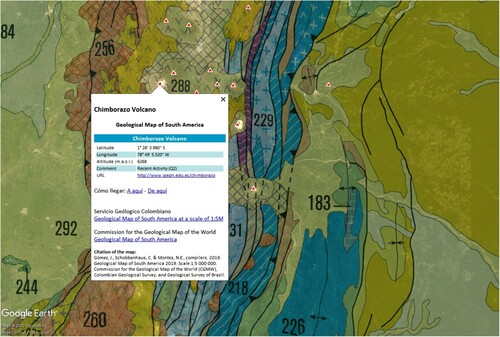
Figure 7. Map view of the Geological Map of South America 2019 in Google Earth and displayed pop-up window that shows information about the Ecuadorian Chimborazo volcano, as an example.
Data availability statement
There is no a data set associated with this paper included in any persistent identifier.
Software
We used Google Earth Pro, Qgis and ArcMap 10.3 software in order to prepare the GMSA in Google Earth. Licenced ArcMAP 10.3 srvlicarcgis.sgc.gov.co own by the Colombian Geological Survey.