
Figures & data
Figure 1. Study area.
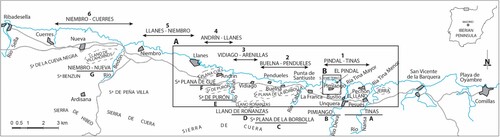
Figure 2. General sequence of marine erosional surfaces (rasas).
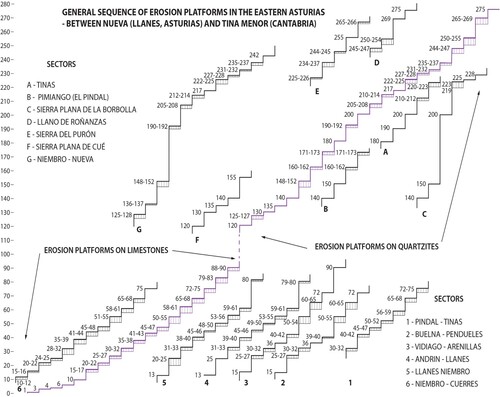
Figure 3. Examples of rasas, indicators of sea-level and palaeographic changes. (A) Rasas eroded on quartzites. There is one below the village of Pimiango at 160–162 m, and another at 150 m (herb packages); they are separated by a glacis. (B) Rasas cut on limestones. The village of Buelna rests on the one at 40-42 m; the one behing the village, near the coast is at 30–32 m. (C) Rasas and caves in limestones,as seen from Los Bufones de Arenillas. Rasas of La Tejera (16 and 31 m) in the first plane and, at the far end, Castro Bellota (40 m). Caves at 2–3 m elevation (Present) and at various elevations in the cliff. (D) Caves of possible marine origin at 65–66 m (Early Pleistocene), when there was a marine connection between Ensenada de Novales and Pendueles beach. At that time, the Piedrallada and Catariello hills formed an island. (E) A current notch, indicator of sea level, at Playa Vidiago; note in the upper part, the superimposition on an older notch. (F) Notches in Playa de Borizu: a fossil notch at 10–11 m and a current one at sea level. (G) Narrow v-shaped valley at the present mouth of the Deva River, as seen from Bustio-Unquera. (H) Fossil valley: abandoned tract with a flat bottom and mature slopes, between Unquera and Pesués.
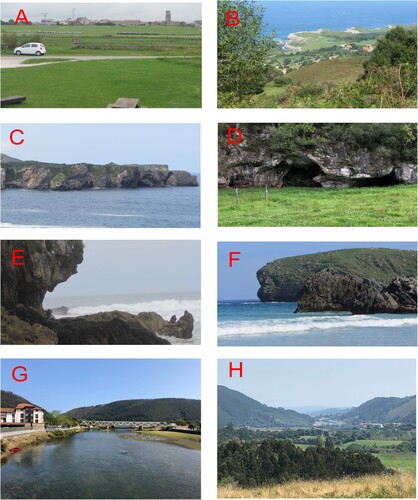
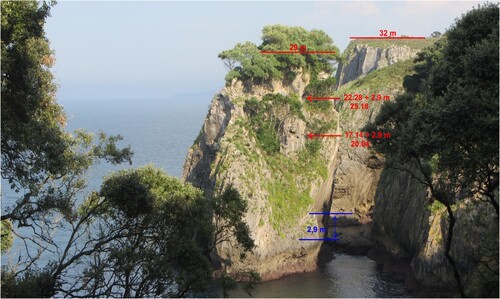
Figure 4. A general sequence of erosional marine terraces (rasas) and other paleo sea-level indicators at El Pindal-Tinas area.
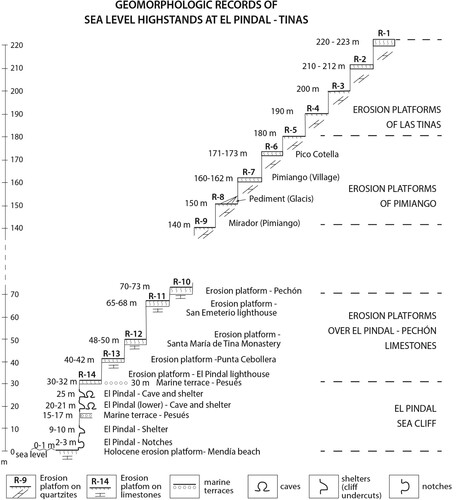
Figure 5. Geomorphological map of the area surrounding El Pindal cave.
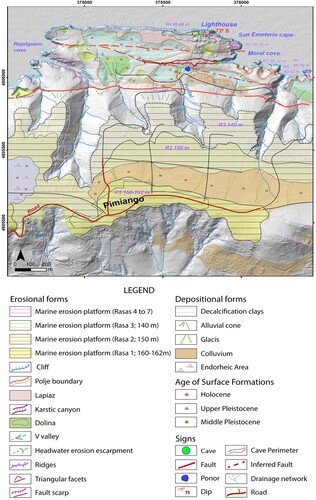
Figure 6. Fallen block in front of the entrance of El Pindal cave.
Supplemental Material
Download Zip (21.4 MB)Data availability statement
The scientific data obtained in this work are published in the text of the article. However, any extension or detail can be requested from the corresponding author.