Figures & data
Figure 1. Geographical setting of the study area. (a) Schematic map of the Ligurian Sea and location of the study area. (b) Bathymetric map of the study area derived from the EMODnet data (CitationFiorentino et al., 2021) with the location of the seismic lines. Black lines: Sub Bottom profiles (SBP); Red lines: Boomer seismic lines.
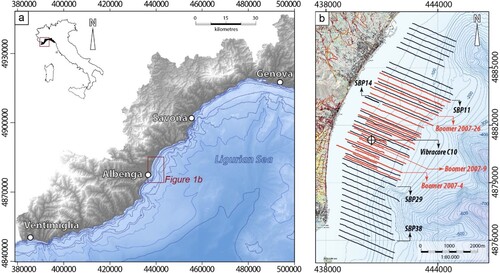
Figure 2. (a) thickness (in meters) of the TRF seismic unit (seismic wave velocity of 1650 m/sec TWTT), corresponding to the Holocene Lutites. (b) Morpho-bathymetric map of the study area showing the location of the shelf-break and the three heads of Albenga, Ceriale and Loano Canyons.
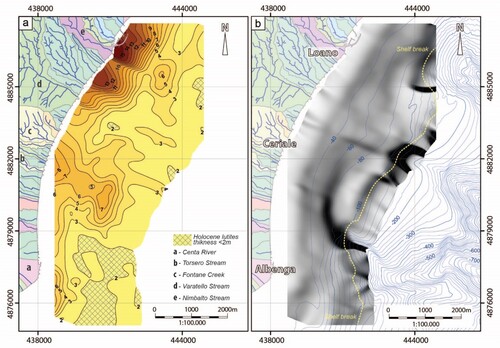
Figure 3. Seismo-stratigraphic architecture of the shelf area in front of Albenga and summary of the identified seismo-stratigraphic units and surfaces of the late Quaternary sequence. The acronyms with their corresponding chrono-stratigraphic units from literature are also indicated. (a) Boomer line 2007–4 showing the thick Plio-Pleistocene deposits buried by the HARF deposits (mainly gravels and sands) and the recent HST deposits (constituted by fine-grained sands and muds). (b) detail of Boomer line 2007–4 highlighting the internal architectures of the Late Quaternary sequence. It is visible, in detail, the retrogressive overlap pattern of the high-amplitude reflective subunits (respectively: TST1-5) and the presence of a buried, very high-amplitude subunits (BHARF) at the base of the transgressive unit.
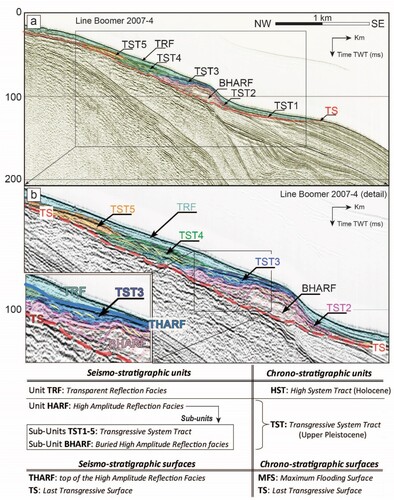
Figure 4. (a) Seismic Boomer line 2007–9 showing the seismo-stratigraphic units TRF, TST3, and their separating surface THARF calibration based on Vibracore C10 data sampling. (b) Vibra-core sampling log reconstruction and a related photo image of coarse littoral sediments (sands and gravels) of the transgressive TST3 subunits and muddy offshore deposits of the TRF unit, corresponding with the Transgressive Systems Tract (TST) and High Stand Systems Tract (HST), respectively.
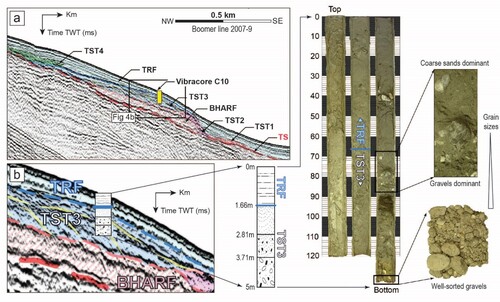
Figure 5. (a) Seismic SBP line 29 showing the common terraced-like arrangement of the HARF Sub-units deposits (TST1-5). (b) Three-dimensional view of the SBP lines showing the high lateral continuity of the HARF subunits highlighted by the high amplitude reflection facies and the terraced arrangement.
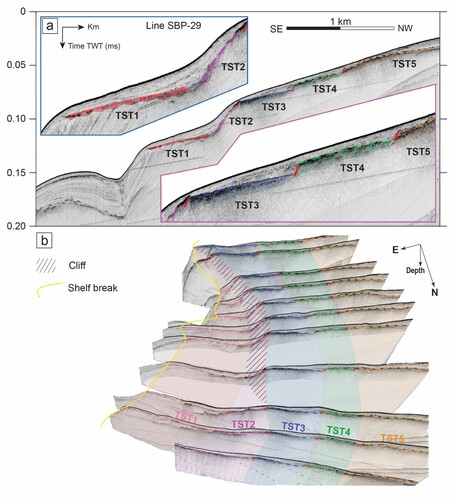
Figure 6. (a) Seismic SBP line 14 (trace in (b)) showing the features of the TST subunits in the shelf area along the Monte Croce High. (b) Seismic Boomer line 2007–26 showing the Plio-Pleistocene morphostructural high outcropping in the outer shelf area bounded by a fault zone with NW dip. Green and orange dashed lines indicate the main Plio-Pleistocene reflectors.
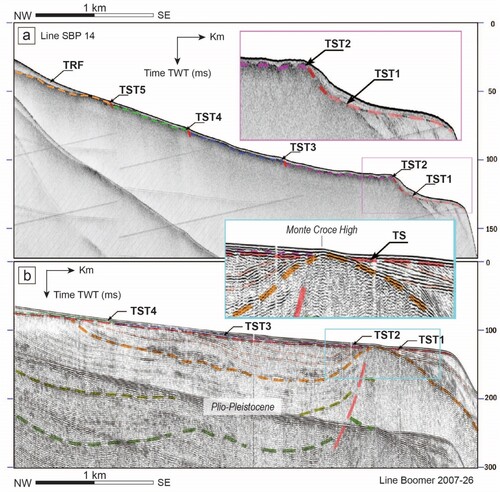
Figure 7. (a) Seismic SBP line 11 shows the accumulation features of the TST1 subunit in the outer shelf area, consisting of symmetrical, high-reflective ridges with troughs filled with less reflective deposits. (c) Seismic SBP line 38 showing a thickness of the TRF unit minimal, or absent, while the THARF reflector is generally more irregular associated with small depressions and sub-outcropping reliefs. (b) and (d) Insets of the TST subunits distribution map with the location of the seismic lines.
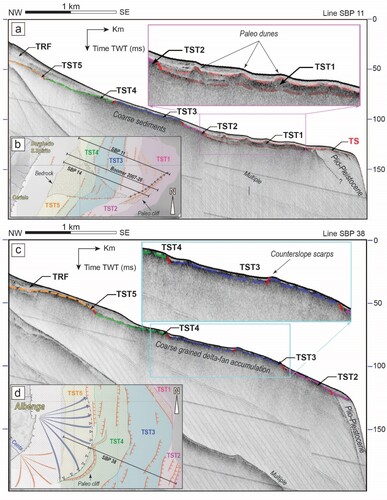
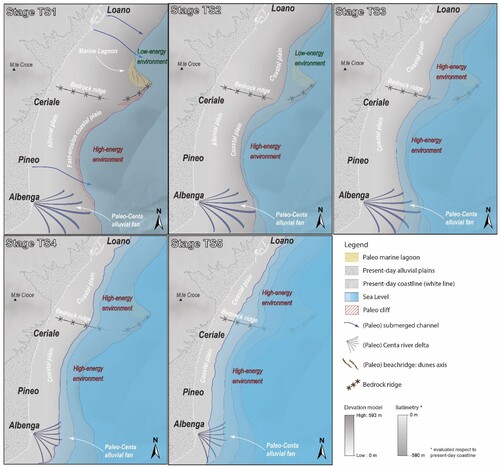
Figure 8. Palaeo-environmental reconstruction of the evolution of the coastal areas between Albenga and Loano since the Last Glacial Maximum. The evolutions steps TST 1, TST2, TST3, TST4 and TST5 were reconstructed based on the distribution of the transgressive deposits TST and their paleo-morphologies.