
Figures & data
Figure 1. Maps presenting different depictions of availability and accessibility to MOUD providers in the US. Map 1displays the scarcity of buprenorphine providers with available patient capacity under the DATA-waiver regulation that ended in June 2023. Maps 2 and 3 show the results of the cluster analysis on the spatial accessibility of OTP facilities and buprenorphine providers, respectively, at census tract level.
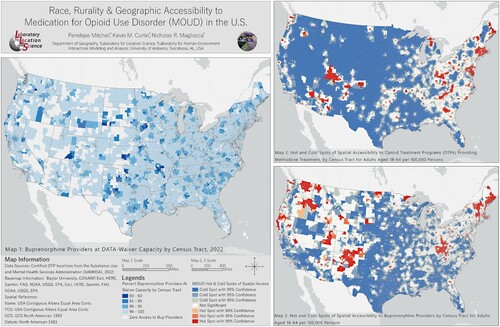
Figure 2. OTP (left) and Buprenorphine (right) provider hot and cold spot percent difference from observed and expected values by Black White racial interaction index within census tracts.
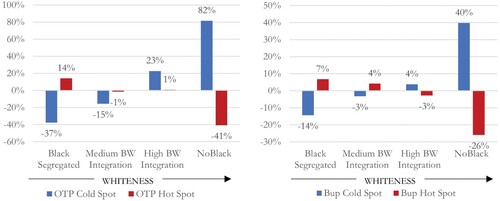
Figure 3. OTP (left) and Buprenorphine (right) provider hot and cold spot percent difference from observed and expected values by Hispanic – not Hispanic ethnic interaction index within census tracts.
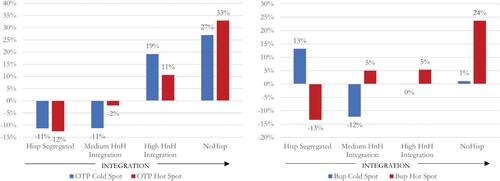
Figure 4. OTP and Buprenorphine (Bup) provider hot and cold spot percent difference from observed and expected values by Black and White racial interaction within census tracts and stratified by 4 class RUCA status.
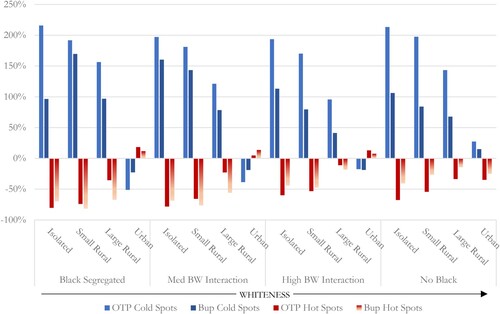
Table 1. Mean, count, and median values of accessibility by census tracts for OTPs (OTPAi), Buprenorphine Providers (Bup Ai), and Buprenorphine Waivers (Bup Wvr Ai) per 100,000 adults aged 18-64. Results are stratified by Black and White racial interaction (BW Intrxn) and four class RUCA status. Percent tracts at waiver capacity and with zero buprenorphine access is also shown.
Figure 5. OTP and Buprenorphine (Bup) provider hot and cold spot percent difference from observed and expected values by Hispanic not-Hispanic ethnic interaction within census tracts and stratified by 4 class RUCA status.
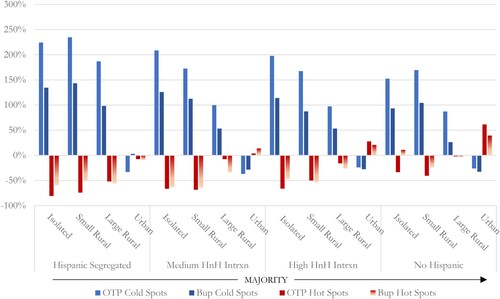
Table 2. Mean, count, and median values of accessibility by census tracts for OTPs (OTPAi), Buprenorphine Providers (Bup Ai), and Buprenorphine Waivers (Bup Wvr Ai) per 100,000 adults aged 18-64. Results are stratified by Hispanic and Not Hispanic (HnH Intrxn) ethnic interaction and four class RUCA status. Percent tracts at waiver capacity and with zero buprenorphine access is also shown.
JoM Combined Layout2.pdf
Download PDF (73.2 MB)Data availability statement
The data that support the findings of this study are available from the corresponding author, P. Mitchell, upon reasonable request.