
Figures & data
Figure 1. Chemical structures of cholecalciferol, calcifediol monohydrate, and calcitriol.
Figure 2. Mean baseline-adjusted serum calcifediol concentrations from 0 to 96 hours after administration of a single dose of Intravenous (IV) or Extended-release (ER) Oral Calcifediol (Phase 2a Study).
Asterisk denotes significant differences between treatment groups at p < 0.05 and bars indicate standard deviation. (Reprinted with permission from Petkovich 2015, Copyright© 2014 Elsevier Ltd, Amsterdam, the Netherlands.)
Figure 3. Mean baseline-adjusted serum 1,25-dihydroxyvitamin D from 0 to 96 hours after administration of a single dose of Intravenous (IV) or Extended-release (ER) Oral Calcifediol (Phase 2a Study).
Note: bars indicate standard deviation. (Reprinted with permission from Petkovich 2015, Copyright© 2014 Elsevier Ltd, Amsterdam, the Netherlands.).
Figure 4. Mean baseline-adjusted plasma intact PTH from 0 to 72 hours after administration of a single dose of Intravenous (IV) or Extended-release (ER) Oral Calcifediol (Phase 2a Study).
Asterisk denotes significant differences between treatment groups at p < 0.05 and bars indicate standard deviation. (Reprinted with permission from Petkovich 2015, Copyright© 2014 Elsevier Ltd, Amsterdam, the Netherlands.).
Figure 5. Mean baseline-adjusted serum 24,25-dihydroxyvitamin D3 concentrations from 0 to 96 hours after administration of a single dose of Intravenous (IV) or Extended-release (ER) Oral Calcifediol (Phase 2a Study).
Asterisks denote significant differences between treatment groups at p < 0.05 and bars indicate standard deviation. (Reprinted with permission from Petkovich 2015, Copyright© 2014 Elsevier Ltd, Amsterdam, the Netherlands.)
Figure 6. Mean (±SE) percent change in PTH from baseline by treatment group at end of treatment (Phase 2b Study). Asterisks denote significant differences between ERC and placebo treatment at p < 0.05 (**) and p < 0.001 (***).
(Reprinted with permission from Sprague 2014, Copyright © 2015 Karger Publishers, Basel, Switzerland.).
Table 1. Subject end-of-treatment characteristics for phase 2b study (per-protocol subjects).
Figure 7. Response rates for PTH reduction of ≥30% from baseline by treatment group, CKD stage and analysis population in the efficacy assessment period (Phase 3 Pivotal Studies A and B). Asterisks denote significant differences between ERC and placebo treatment at p < 0.05 (*) and p < 0.01 (**).
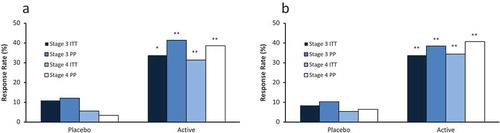
Figure 8. Mean (±SE) percent change from baseline over time in PTH by treatment group and Stage 3 (S3) or Stage 4 (S4) in the per protocol population (Phase 3 Pivotal Studies A and B).
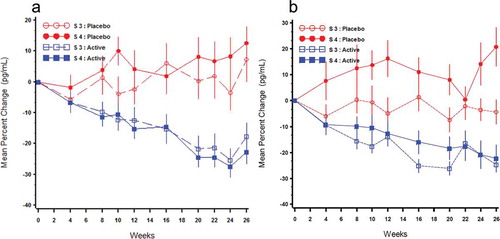
Figure 9. Plasma PTH as a function of serum total 25-hydroxyvitamin D (25OHD) in the efficacy assessment period (Pooled Data from Phase 3 Pivotal Studies). Asterisks denote significant differences from 0-20 ng/mL group at p < 0.001 and bars indicate standard error.
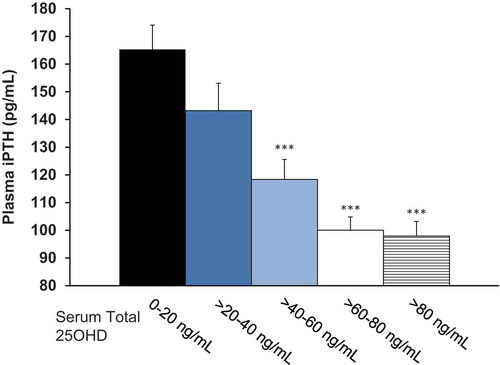
Figure 10. Mean (±SE) percent change from baseline over time in PTH by treatment group and CKD stage in the per protocol population (combined data from Phase 3 pivotal and extension studies).
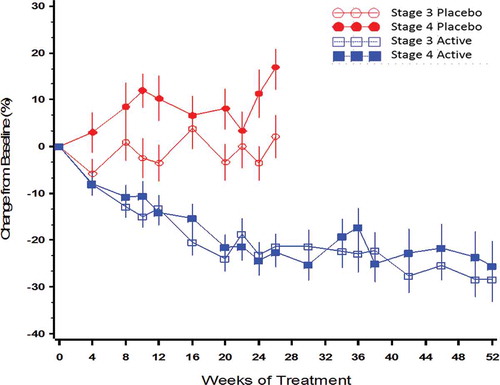
Table 2. Baseline and end-of-treatment parameters from phase 3 pivotal (Studies A and B) and extension trials (per-protocol subjects).
Table 3. Comparison of effects on blood bone and mineral parameters of ERC versus other vitamin D therapies.