
Figures & data
Figure 1. Schematic figure of stage 1 and 2.
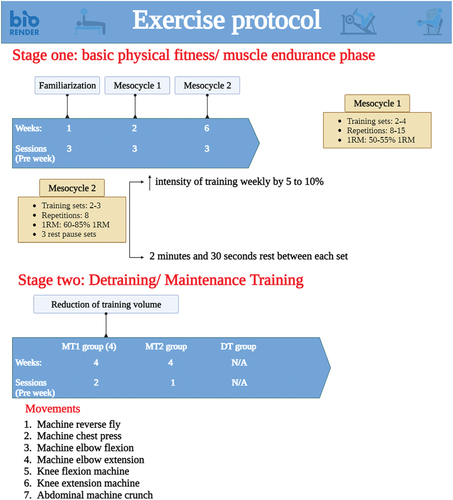
Table 1. Baseline characteristics and sarcopenia index of each group (mean ± SD)*.
Table 2. Basal serum hormone concentrations at weeks 0, 8, and 12 (mean ± SD).
Table 3. Basal serum hormone concentrations at weeks 0, 8, and 12 (mean ± SD).
Figure 2. The results of the one-way analysis of variance test, the significant comparison of the mean difference between post-test 1 and post-test 2 serum levels of MSTN (ng/L) and Fstn (ng/L) in MT1, MT2, DT, C groups. * significance of MT1 with the control group; ** significance of MT2 with the control group; *** significance of DT with the control group; $ significance of MT1 with the DT group and # significance of MT2 with the DT group.
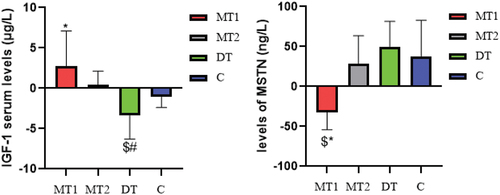
Figure 3. The results of the one-way analysis of variance test, the significant comparison of the mean difference between post-test 1 and post-test 2 serum levels of Fstn (ng/L) and cot (ng/L) in MT1, MT2, DT, C groups. * significance of MT1 with the control group; ** significance of MT2 with the control group; *** significance of DT with the control group; $ significance of MT1 with the DT group and # significance of MT2 with the DT group.
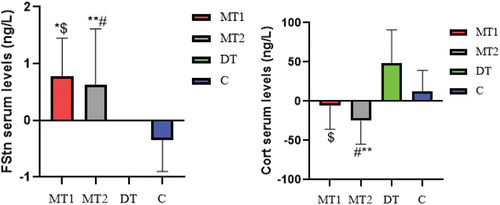
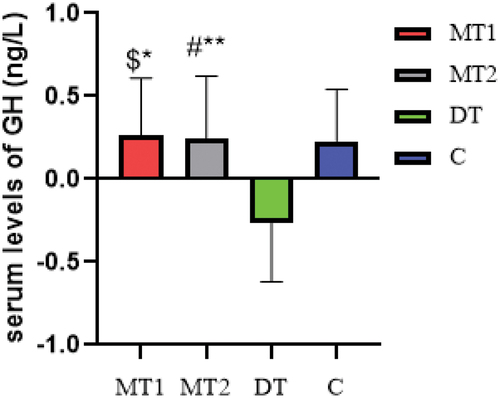
Figure 4. The results of the one-way analysis of variance test, the significant comparison of the mean difference between post-test 1 and post-test 2 serum levels of HJ (ng/L) in MT1, MT2, DT, C groups. * significance of MT1 with the control group; ** significance of MT2 with the control group; *** significance of DT with the control group; $ significance of MT1 with the DT group and # significance of MT2 with the DT group.
Data availability statement
All data generated or analyzed during this study are included in this published article.