1,564
Views
14
CrossRef citations to date
0
Altmetric
Original Research

Systemic inflammatory immune signatures in a patient with CRB1 linked retinal dystrophy

, , , , &
Pages 1359-1362 | Received 13 Jul 2016, Accepted 23 Sep 2016, Published online: 06 Oct 2016

Figures & data

Figure 1. Cystoid macular edema at several time points during immune-monitoring. (a) Upper left and right: fluorescein angiography of the right and left eye of an patient with retinal dystrophy at presentation revealing extensive fluorescein leakage in the macular area. Lower left en right: fundoscopy color images of the right and left eye of the same patient at presentation. (b) Optical Coherence Tomography images of the macula of the right (upper image) and left (lower image) eye at presentation revealing CME. (c) Dynamics of foveal thickness (measured by OCT), the frequency of CD1c+ mDC cells in blood and their activation status (measured by expression of activation marker CD86) through time.

CME: Cystoid Macular Edema; mDC: myeloid dendritic cell; MFI: mean fluorescence intensity; OCT: Optical Coherence Tomography.

Figure 1. Cystoid macular edema at several time points during immune-monitoring. (a) Upper left and right: fluorescein angiography of the right and left eye of an patient with retinal dystrophy at presentation revealing extensive fluorescein leakage in the macular area. Lower left en right: fundoscopy color images of the right and left eye of the same patient at presentation. (b) Optical Coherence Tomography images of the macula of the right (upper image) and left (lower image) eye at presentation revealing CME. (c) Dynamics of foveal thickness (measured by OCT), the frequency of CD1c+ mDC cells in blood and their activation status (measured by expression of activation marker CD86) through time.CME: Cystoid Macular Edema; mDC: myeloid dendritic cell; MFI: mean fluorescence intensity; OCT: Optical Coherence Tomography.

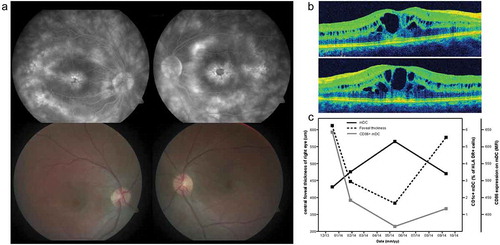
Table 1. Cytokine analysis in serum of a patient with retinal dystrophya.