
Figures & data
Figure 1. Data identification, screening, eligibility and inclusion.
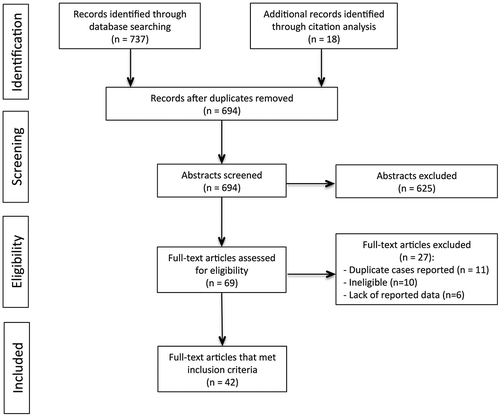
Table 1. Summary of designs, time points of assessments, and effectiveness outcomes reported.
Table 2. Summary of demographics and baseline characteristics.
Table 3. Summary of outcome measures (all studies: n = 42).
Figure 2. Effectiveness outcomes: % increase from baseline for FEV1, ACT, GINA and AQLQ.
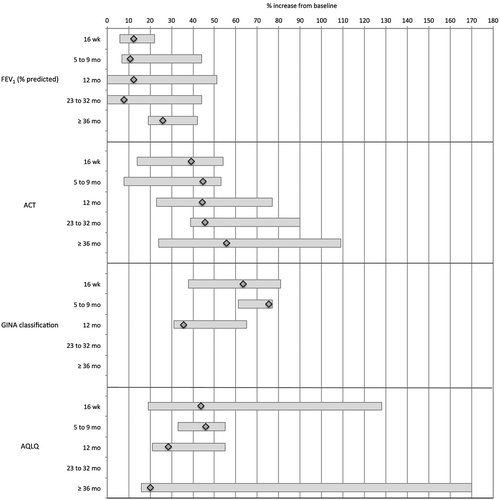
Figure 3. Effectiveness outcomes: % decrease from baseline for asthma symptoms and healthcare utilization.
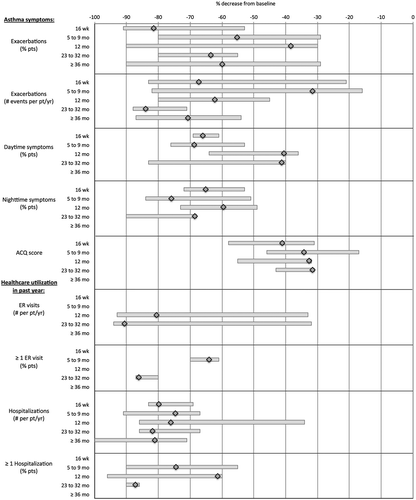
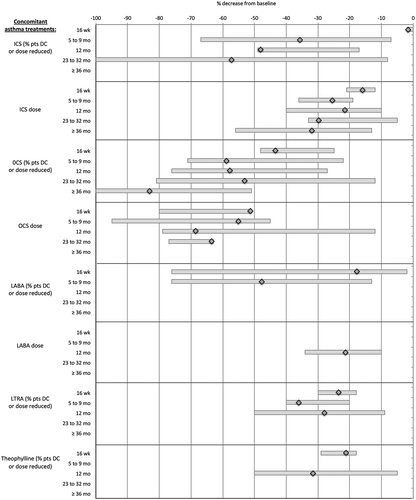
Figure 4. Effectiveness outcomes: % decrease from baseline for concomitant asthma treatments.
Supplemental material