
Figures & data
Figure 1. Changing Patient Perspective Through Pictorial Aids. (a) Drug A, B, and C demonstrate the rate of occurrence of side effects per 100 of 1, 2 and 3, respectively. Drug C looks more worrisome than the rest. (b) Drug A, B and C had a rate of no occurrence of side effects per 100 of 99, 98 and 97, respectively and the difference between them is barely noticeable. (c) Pictorial aids give the perspective on why Graph A and B can be so similar in numbers but so different in context. This is because patients fear being part of the 2% (when being told the rate of side effects) but find more reassuring being part of the 98% (when being told the rate of no side effects)
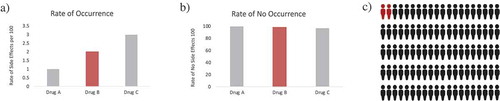
Table 2. Strategies for a better patients’ understanding of biologics’ safety