
Figures & data
Figure 1. Distribution of primary immunodeficiency prevalence in the world based on the number of reported patients per 100000 individuals (Gray color represents countries without registry or without published report).
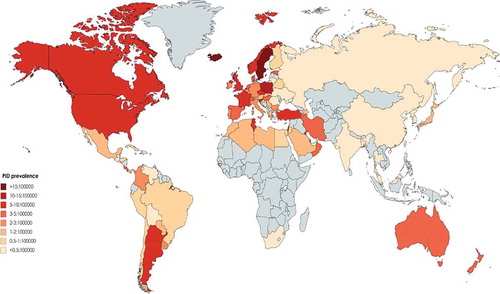
Figure 2. Distribution of parental consanguinity among different registries of patients with primary immunodeficiency in the world. (Gray color represents countries without registry or without appropriate report).
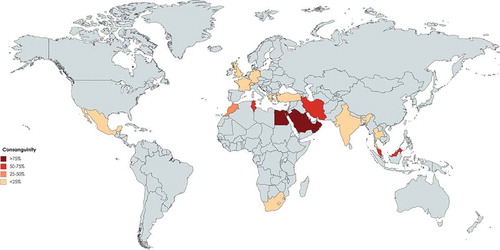
Figure 3. Proportion of predominant antibody deficiencies among different registries of patients with primary immunodeficiency in the world. (Gray color represents countries without registry or without appropriate report).
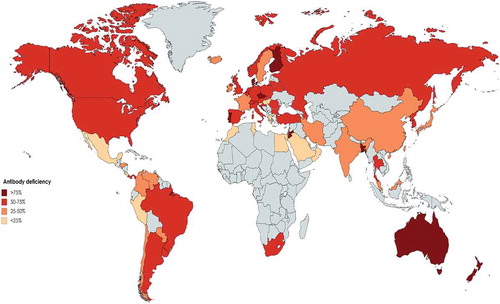
Figure 4. Proportion of male to female ratio among different registries of patients with primary immunodeficiency in the world. (Gray color represents countries without registry or without appropriate report).
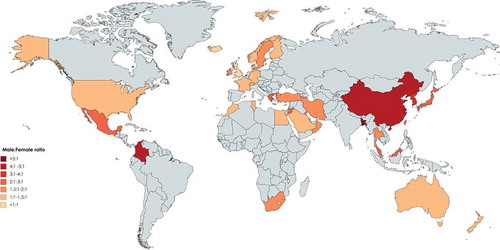
Figure 5. Proportion of molecular diagnosis among different registries of patients with primary immunodeficiency in the world. (Gray color represents countries without registry or without appropriate report).
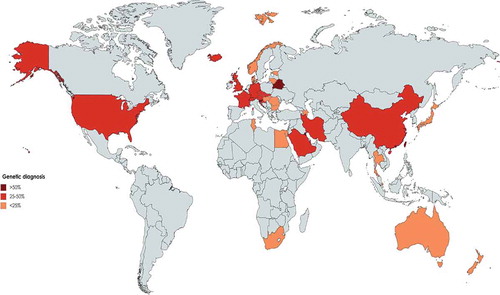
Table 1. The frequency of diagnosed primary immunodeficiency (PID) cases in the world and percentage of Predominantly antibody deficiencies (PAD), immunodeficiencies affecting cellular and humoral immunity (CID), congenital defects of phagocyte number or function, complement deficiencies and other PIDs (including syndromic CID, diseases of immune dysregulation, defects in intrinsic and innate immunity, autoinflammatory disorders and PID phenocopies).