Figures & data
Figure 1. The main serological methods for detection of SARS‑CoV‑2 infection
a) The brief mechanism of ELISA, CLIA, and LFIA, the main serological methods for COVID-19 diagnosis, their diagnostic performances and their disadvantages were demonstrated [Citation16]. b) The comparisons between different cases in each method and between different methods are shown.
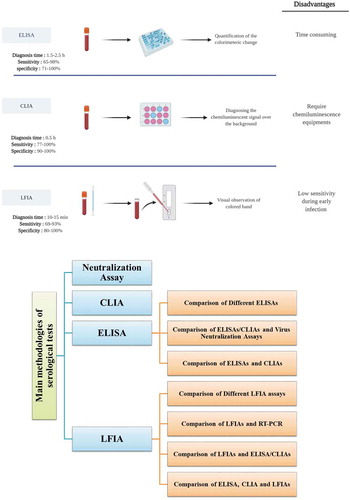
Figure 2. The structure of SARS-CoV-2 virus
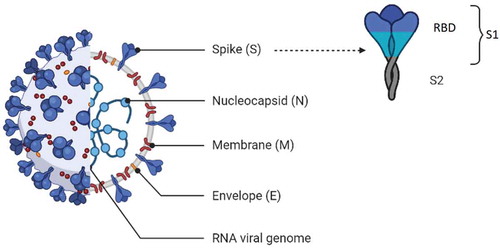
Figure 3. Mechanism of surrogate virus neutralization test (sVNT)
In the sVNT assay, a sample contains neutralizing antibodies (nAbs) is recognized. NAbs block the interaction between HRP-conjugated RBD protein and the hACE2 protein pre-coated on an ELISA plate [Citation53]. HRP: horseradish peroxidase, RBD: receptor-binding domain, TMB: 3,3ʹ,5,5ʹ-Tetramethylbenzidine and ACE2: angiotensin-converting enzyme-2.
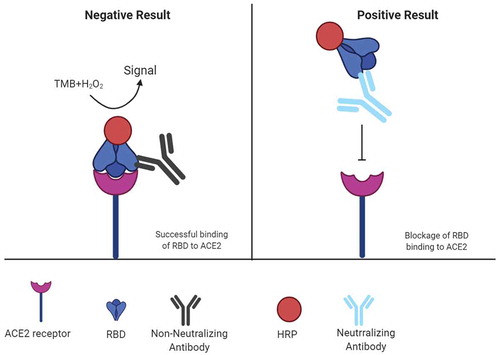
Figure 4. Electrochemiluminescence-based anti-SARS‑CoV‑2 immunoassay
In the first step, the patient sample is mixed with biotinylated SARS‑CoV‑2‑specific recombinant nucleocapsid (N) antigen and SARS‑CoV‑2‑specific recombinant N antigen labeled with a ruthenium complex and then double-antigen sandwich immune complexes are formed. Next, streptavidin-coated microparticles are added and the complex binds to the solid phase via interaction of biotin and streptavidin. After transferring the mixture to the measuring cell, the microparticles are magnetically captured onto the surface of the electrode. In the next step, electrochemiluminescence is induced by applying a voltage to the electrode and then is measured by a photomultiplier.
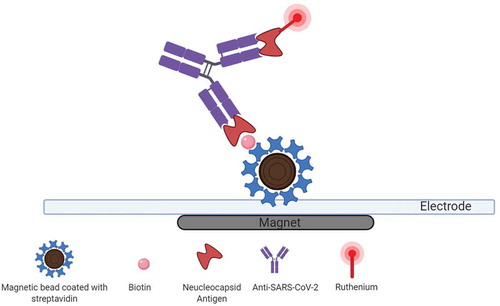
Table 1. Comparison of COVID-19 ELISA/CLIA and neutralization assays
Table 2. Comparison of COVID-19 ELISAs and CLIAs
Figure 5. Lateral flow immunoassays (LFIAs) for diagnosis of COVID-19
A sample that may have anti-SARS-CoV-2-IgM or/and Anti-SARS-CoV-2-IgG is loaded on an adsorbent sample pad. Then, colloidal gold conjugated-SARS-CoV-2 antigen in conjugate release pad interacted with the target antibodies in a sample. Afterward, immobilized anti-human IgG and/or IgM antibodies captured the anti-SARS-CoV-2 antibody/conjugated-SARS-CoV-2 antigen complex in detection zone of a strip and a colored band appear [Citation84].
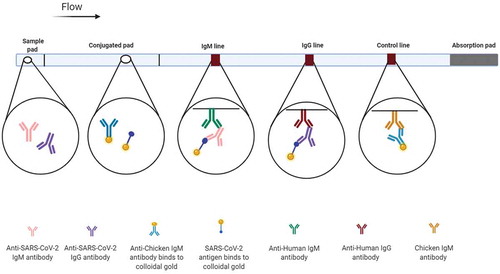
Table 3. Comparison of COVID-19 LFIAs and ELISA/CLIAs
Table 4. Comparison of COVID-19 ELISA, CLIA and LFIAs
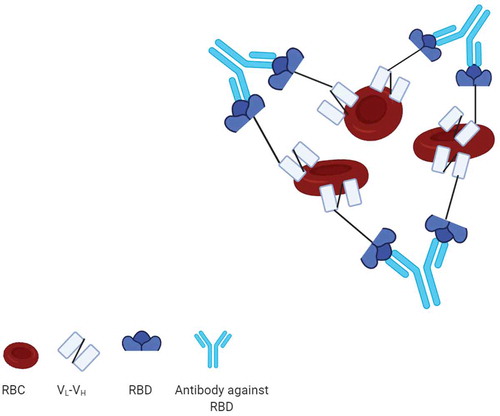
Figure 6. Mechanism of red blood cell agglutination assay
A fusion protein containing RBD of the SARS-CoV-2 at the N-terminus and a single-chain variable fragment (scFv) at the C-terminus targeting the red blood cell (RBC) was constructed. The mixture of patient serum/plasma containing anti-RBD antibodies, the fusion protein (RBD-scFv), and RBCs led to cross-linking multiple RBCs in mass that could be observed with the naked eye [Citation106]. VH: variable heavy; VL: variable light.