Figures & data
Table 1. Sample selection
Table 2. The disclosure index
Table 3. Definition of test and control variables
Table 4. Pearson correlation test between the test variables
Table 5. Descriptive statistics
Table 6. Governance characteristics of the 163 family firms
Table 7. Descriptive statistics on the disclosure index
Table 8. Regression results
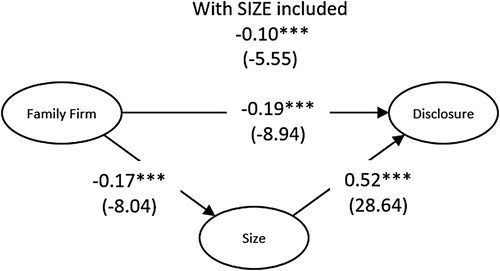
Figure 1. Path analysis
Note: Reported values are the standardized beta coefficients and t-values within parentheses, where the significant levels are denoted as follows: *p < .10, **p < .05, ***p < .001. Following steps are followed in the path analysis: Step 1: DSCORE = β0 + β1FAMILY1 + e; Step 2: DSCORE = β0 + β1SIZE1 + e, Step 3: SIZE = β0 + β1FAMILY1 + e and Step 4: DSCORE = β0 + β1FAMILY1 + β1SIZE1 + e.