
Figures & data
Table 1. List of the sustainable development goals (UN Resolution A/RES/70/1).
Table 2. Sample description.
Table 3. Measurement scheme SDG reporting quality.
Table 4. Descriptive statistics on SDG reporting.
Figure 1. Reporting Quality by Reporting Item and Year. This figure presents the yearly percentage of reports disclosing the reporting quality indicators in the categories ‘Definition and Prioritization’ (DEF) and ‘Measurement and Analysis’ (MEA) as defined in . Percentages are based on the yearly total number of reports referring to the SDGs (SDG_BINARY = 1).
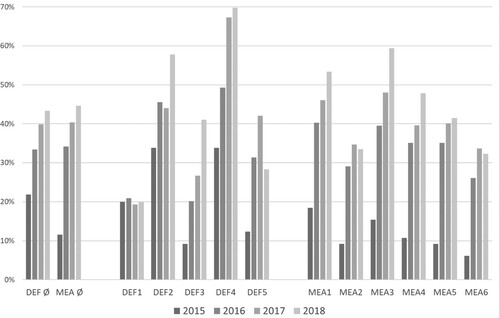
Figure 2. Prioritization Outcome (DEF4) by SDG. Panel A: Prioritization Outcome. Panel B: Prioritization Outcome by Year. This figure presents the percentage of reports prioritizing each individual SDG. Panel A presents percentage values of these references for the total sample period. Percentages are based on the total number of reports disclosing the outcome of SDG prioritization (DEF4 = 1). Panel B presents the total number of references of the respective SDG for each reporting year. A list of the SDGs is provided in .
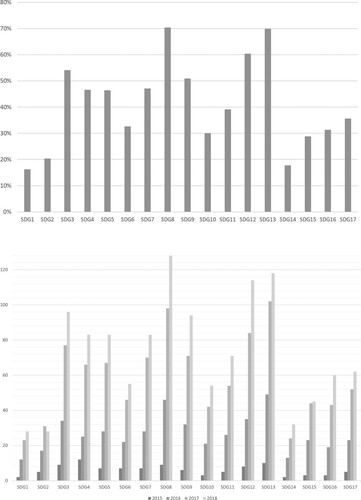
Figure 3. Reporting Quality by SDG based on Prioritization Outcome (DEF4). This figure presents the percentage of reports disclosing information on the individual SDGs for the disclosure indicators MEA1 (qualitative targets), MEA2 (quantitative targets), MEA3 (specific actions) and MEA6 (future actions). Disclosure indicators are defined in . Percentages are based on the total number of reports disclosing the outcome of SDG prioritization (DEF4 = 1) and prioritizing the respective SDG. A list of the SDGs is provided in .
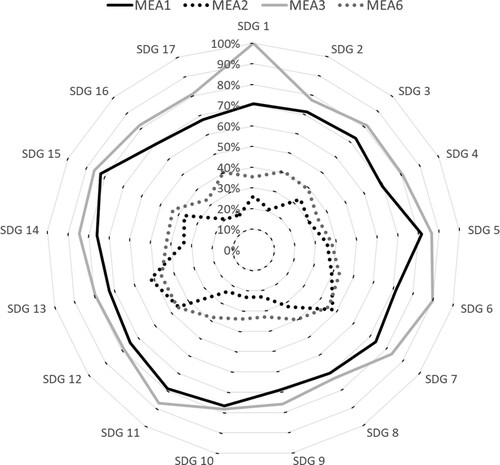
Table 5. Descriptive statistics of the regression variables.
Table 6. Pearson correlation statistics.
Table 7. Findings from the regression analysis.
Table 8. Findings from regression analysis additionally controlling for firm-level variables.
Table 9. Findings from regression analysis additionally controlling for institutional factors.
Appendix IV. Variable Descriptions
Appendix I. Exemplary Excerpts from Firms’ Annual Reports for SDG_QUAL
Appendix II. List of Search Terms to Capture the Prevalence of SDG Topics.
Appendix III. Overview of the Top Ten Words in the Respective SDG-Vocabularies.
