
Figures & data
Table 1. Overview of the five experimental conditions and number of participants per cell.
Table 2. Overview of socio-demographic information of participants.
Table 3. Means and standard deviations of dependent variables by factor levels.
Table 4. Means and standard deviations of dependent variables by experimental conditions.
Table 5. Difference in means of dependent variables of control group against other experimental conditions.
Table 6. Multivariate analysis of variance (MANOVA) results [Wilks’ Lambda].
Table 7. Analysis of variance (ANOVA) results for dependent variable RELY.
Table 8. Analysis of variance (ANOVA) results for dependent variable ADVICE.
Figure 1. ANOVA results for dependent variable ADVICE.
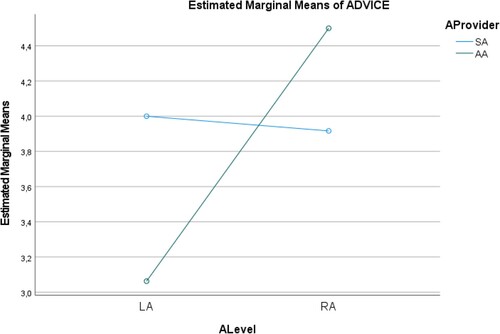
Table 9. Analysis of variance (ANOVA) results for dependent variable CREDIT.
Figure 2. ANOVA results for dependent variable CREDIT.
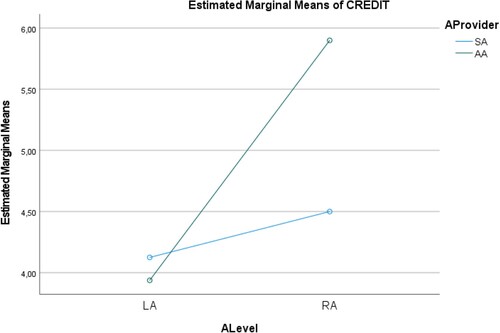
Table 10. Analysis of variance (ANOVA) results for dependent variable INVEST.