
Figures & data
Figure 1. Screenshots from a handle-bar mounted, forward-facing camera in Field Study 1, where the cyclist rode on the street
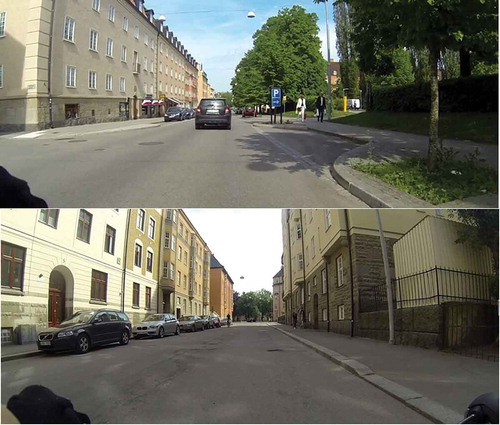
Figure 2. Screenshots from a handle-bar mounted forward-facing camera in Field Study 1, where the cyclist rode on the pavement
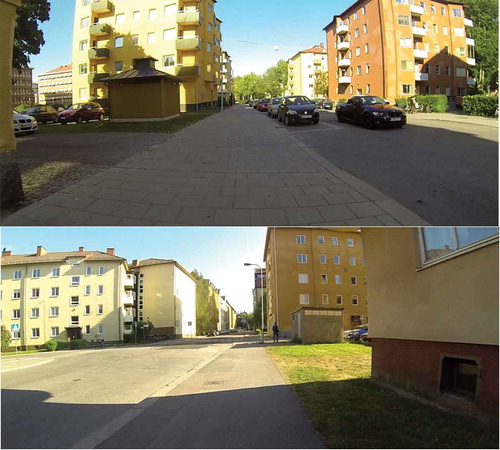
Figure 3. Participant riding on the pavement. Screenshot from the following experimental leader’s handle-bar mounted camera in Field Study 2
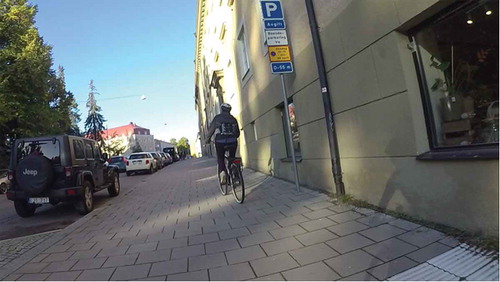
Table 1. Pavement riding propensity for different cyclist groups in Field Studies 1 and 2, on the 685 m long road stretch with mixed traffic. (part. = participant, conf. = confident, unconf. = unconfident; total time is presented as mean and standard deviation.)
Table 2. Distribution of indicated route choice depending on the infrastructural design in percentage. The figures do not add up to 100%, as respondents had the option of indicating ‘other’ when marking their route choice