
Figures & data
Table 1. Description of measures.
Table 2. Characteristics of children and caregivers at program intake for full sample and by ethnicity
Figure 1. Average PPVT-III scores between intake and adolescence for all children and by child gender.
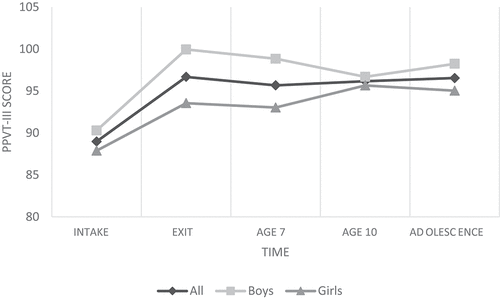
Figure 2. Average PPVT-III scores between intake and adolescence for all children and by ethnicity.
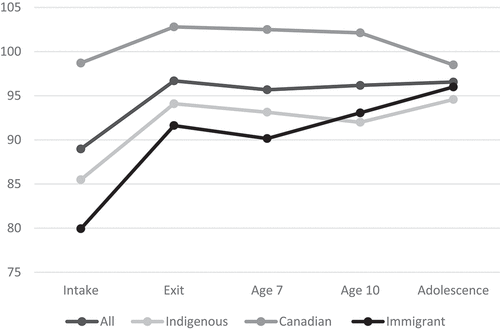
Table 3. Bivariate correlations between average PPVT-III scores between intake and late adolescence and variables considered for inclusion in the final model
Table 4. Mixed-effects model showing association between the PPVT-III scores at adolescence and other variables
Data availability statement
Data are available from the first author upon reasonable request from qualified researchers.
This study was performed in accordance with the ethical standards as laid down in the 1964 Declaration of Helsinki and its later amendments. The Conjoint Health Research Ethics Board at the University of Calgary (REB13–0750) approved the study. Written, informed consent was obtained from parents or legal guardians of children, which included consent to publish aggregated data.