
Figures & data
Figure 1. Concentration of glucose [a], β-hydroxybutyrate (BHB) [b] and non-esterified fatty acids (NEFA) [c] in blood serum of dairy cows exposed to increasing concentrations of pyrrolizidine alkaloid (PA) over the course of the trial.
![Figure 1. Concentration of glucose [a], β-hydroxybutyrate (BHB) [b] and non-esterified fatty acids (NEFA) [c] in blood serum of dairy cows exposed to increasing concentrations of pyrrolizidine alkaloid (PA) over the course of the trial.](/cms/asset/0cc1e601-3d66-4489-a246-64d135a4fa20/gaan_a_2350095_f0001_oc.jpg)
Figure 2. Composition of abdominal adipose tissues (AAT) containing retroperitoneal at (RAT), omental at (OAT), mesenteric at (MAT) before the start of the trial and at the end of the trial (d28) (left ordinate) and the resulting AAT in absolute masses (right ordinate) of the treatment groups determined by ultrasonic measurement method.
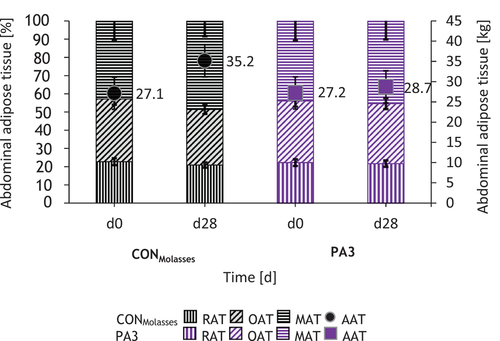
Table 1. Mean relative organ weights of dairy cows after a short-term PA exposure scenario on exposure day 28 with corresponding p-Values.
Figure 3. Liver histopathology scores for the different PA exposure groups on day 28.
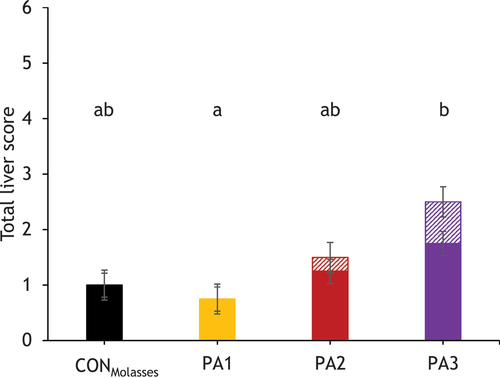
Figure 4. Liver histology of the control group. CONMolasses (<0.01 mg PA/kg BW/d, left pictures) and group PA3 (1.91 mg PA/kg BW, right pictures) at 200 and 400 times magnification at day 28 of the experiment.
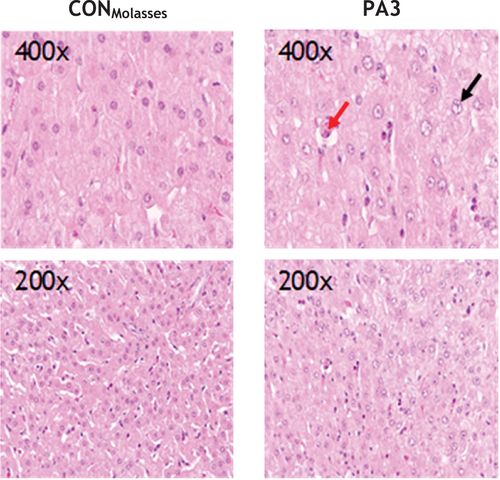
Table 2. Histopathological findings in the liver of dairy cows on days 0, 7 and 28 of the PA exposure with regard to enlargement of the hepatocyte nuclei (*) and immunological activity (+), characterised by focal infiltration of macrophages with multinucleated giant cells (granulomatous inflammation) and eosinophilic granulocytes, multifocal lymphohistiocytic portal infiltration with eosinophilic granulocytes or focal lymphohistiocytic infiltration. A symbol within a category represents an individual animal (n = 4 per group).
Figure 5. Hepatocyte nucleus area [a] and total liver lipid concentration [b] over the course of the experiment, with day 0 indicating the value before the start of PA exposure.
![Figure 5. Hepatocyte nucleus area [a] and total liver lipid concentration [b] over the course of the experiment, with day 0 indicating the value before the start of PA exposure.](/cms/asset/16356e76-cb7a-4af1-8a0e-24db59c45dfd/gaan_a_2350095_f0005_oc.jpg)
Figure 6. Relative organ weight of the filled gallbladder after 28 days of PA exposure of the different exposure groups.
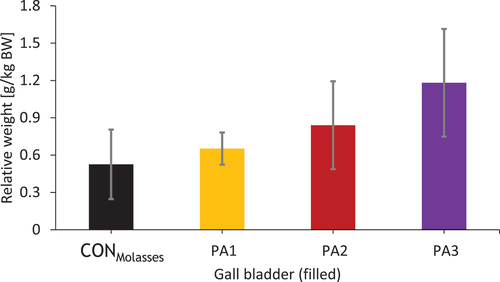
Table 3. Histopathological findings in organs of dairy cows on day 28 concerning immunological activity (+), while a symbol within a category represents an individual animal (n = 4 per group).