Figures & data
Figure 1. Map of Bakkhali river estuary and location of sampling stations.
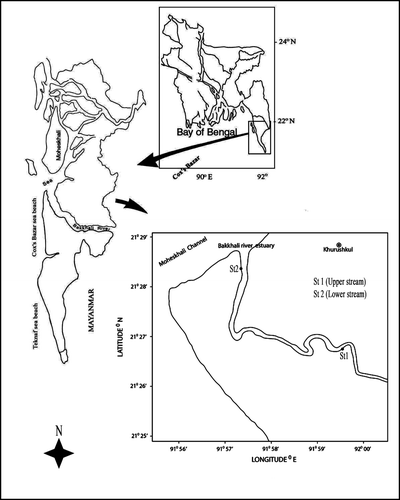
Figure 2. A Char jal in the Bakkhali river estuary.
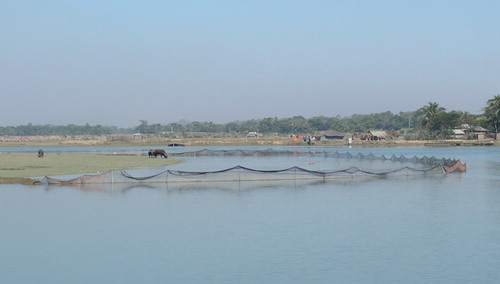
Figure 3. Temporal and spatial variations in mean environmental parameters at the study area (s, St, st, station).
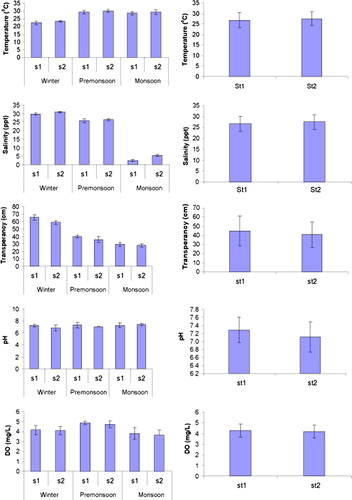
Table I. Mean of the different environmental parameters in different seasons and stations during the study period.
Table II. Fish and shrimp species recorded in the Bakkhali river estuary from December 2007 to August 2008 showing relative contribution (%) to the total abundance by stations and seasons.
Figure 4. Temporal and spatial variations of (A) Shannon–Wiener index and Abundance and (B) Margalef diversity index and Abundance of the Bakkhali fish and shrimp assemblage. St, station. St, station.
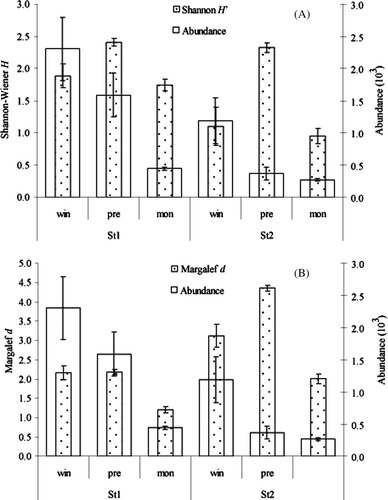
Table III. Result of one-way ANOSIM (R value and significant levels) and SIMPER analysis of fish and shrimp abundance between stations and different seasons.
Table IV. Average similarity and discriminating fish and shrimp in each station using SIMPER analysis.
Table V. Average similarity and discriminating fish and shrimp in each season using SIMPER analysis.
Figure 5. Dendrogram (A) showing cluster based on Bray–Curtis similarity matrix of catch composition, and the ordination in 2D (B) using MDS on the same similarity matrix. St, Station; W, Winter; P, Premonsoon; M, Monsoon.
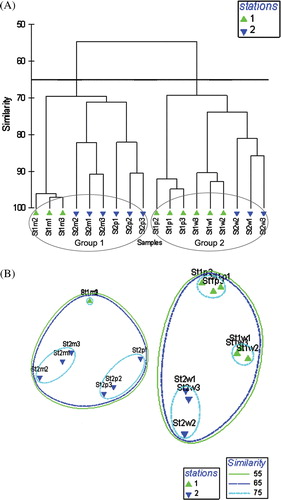
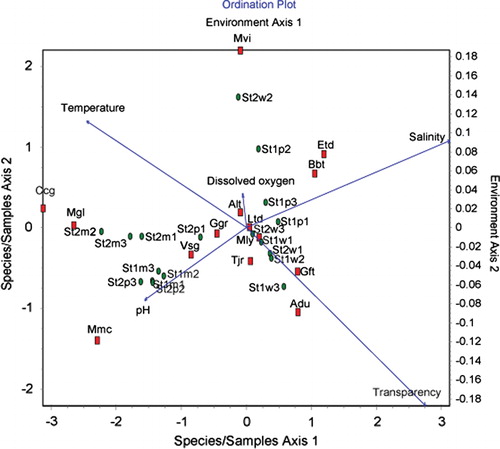
Figure 6. The CCA ordination of species abundance and environmental parameters (code for each species is given in ; St, station; p, premonsoon; m, monsoon w, winter).