Figures & data
Table I. Details of the cytochrome c oxidase subunit I (COI) sequences of the 12 species of Upeneus included in the genetic study. Information provided includes the species assignment in the present study, the species identity under which the data are accessioned on BOLD and/or GenBank (if different from the identification in the present study), the GenBank number and/or the BOLD Process ID (if available), the collection locality, the accession details of the corresponding voucher specimen, and details on the original reference for the data and/or other significant information. SAIAB accession numbers presented in parentheses refer to lots for which no vouchers are retained, but for which associated images (e-vouchers) and tissue samples have been catalogued.
Table II. Morphometrics, meristics, and caudal-fin colour characters in four species of Upeneus.
Figure 1. (A) U. suahelicus, SAIAB 13948, HT, 10.1 cm SL, Kenya (P.C. Heemstra); (B) Upeneus suahelicus, SAIAB 97929, 10.4 cm SL, Fort Dauphin, Madagascar (P.C. Heemstra); (C) U. indicus, BPBM 27524, HT, 13.7 cm SL, Cochin, W India (J.E. Randall); (D) U. supravittatus, SAIAB 187367, 11.7 cm SL, Negombo, Sri Lanka (F. Uiblein); (E) U. supravittatus, BPBM 20504, PT, 12.0 cm SL, Madras, E India (J.E. Randall); (F) U. vittatus, 16.1 cm SL, Zanzibar Channel, Tanzania (J.E. Randall).
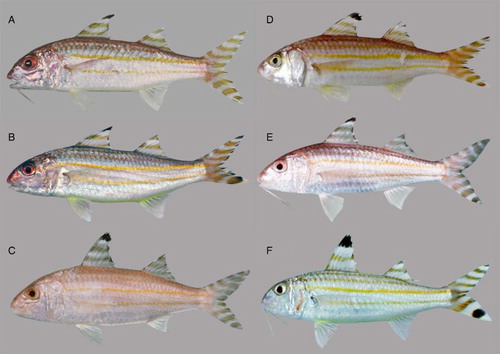
Figure 2. Morphological distinction among the four species using SL, three morphometric characters, and total number of gill rakers, with polygons drawn for delimiting species (U. suahelicus – continuous line; U. supravittatus – dashed line; Upeneus vittatus – dotted line). The three specimens not placed within the two barcoding clades (see and text) are indicated by filled (i.e., completely black) symbols.
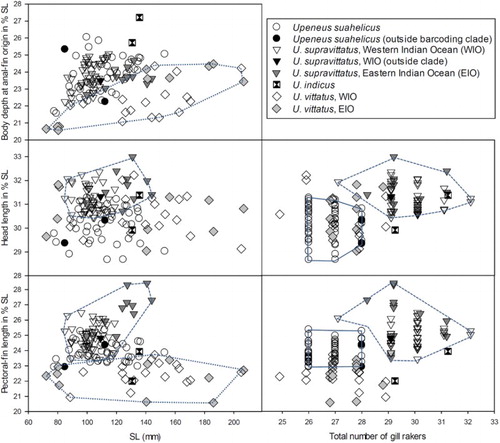
Figure 3. Meristic characters for the three quantitatively studied species indicating pairs of species which do not differ significantly (‘ns’) based on the Chi2 test for trends. The three specimens not placed within the two barcoding clades (see and text) are indicated by filled circles.
Figure 4. Counts of caudal fin bars for the three quantitatively studied species indicating pairs of species which do not differ significantly (‘ns’) based on the Chi2 test for trends.
Figure 5. Maximum-likelihood phylogram (–lnL = 2329.670) of relationships among the included individuals of 12 species of Upeneus from the analysis of COI sequence data. The tree was rooted with U. guttatus, U. heemstra, U. margarethae, U. parvus and U. tragula as outgroups. Bayesian Posterior Probabilities (BPPs) from the Bayesian inference and bootstrap support from the parsimony analysis are presented on the nodes (in the order BPP/bootstrap). Only BPPs > 0.95 and bootstraps > 75% are shown. Clades formed by U. supravittatus and U. suahelicus are indicated as A and B, respectively. Terminal names include GenBank accession numbers or BOLD Process IDs, as well as sampling regions.
Figure 6. 95%-credible parsimony network indicating genealogical relationships among the 18 cytochrome c oxidase subunit I (COI) haplotypes found within the 52 Upeneus suahelicus and U. supravittatus specimens included in the genetic study. The sizes of the circles correspond to the frequency occurrence of each haplotype, according to the inset. The U. supravittatus (A) and U. suahelicus (B) haplogroups are indicated. Colours indicate the species identifications of individuals in which each haplotype was found. Each node represents one mutational step with small grey circles representing unsampled or missing haplotypes.