Figures & data
Figure 1. (a) Areal overview of Lac Bay, Bonaire, with an outline of the mangrove, seagrass and coral reef areas. (b) Seagrass meadow in Lac Bay dominated by Halophila stipulacea. (c) Set-up of the fragment settling experiment; the orange tether is indicated by the red arrow. (d) One of the experimental H. stipulacea fragments 6 days after settlement. The red circle indicates the original tethered fragment. The plant material outside the red circle was grown since settlement. Map (a) by Google Maps®, photos (b,c,d) by Fee Smulders.
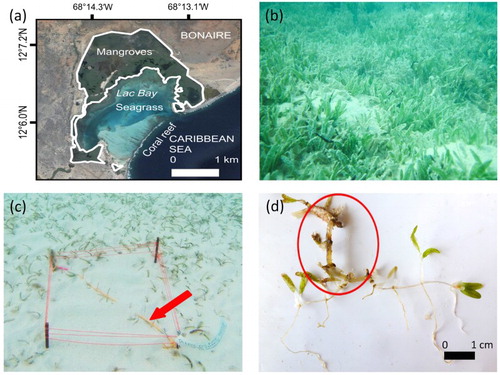
Figure 2. The occurrence and distribution of Thalassia testudinum, Halophila stipulacea and Syringodium filiforme in (a) 2011, (b) 2013 and (c) 2015 at the 49 fixed sampling locations in Lac Bay, Bonaire.
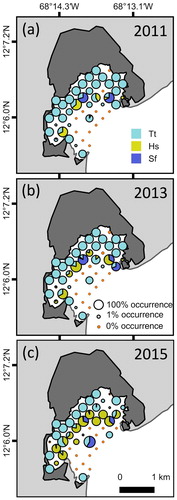
Figure 3. The average (±SE) percentage occurrence of each seagrass species per m2 per year; significant differences between years are indicated with *. The table below the occurrence graph displays the percentage of fixed sampling locations (n = 49) that is occupied per species in each year in Lac Bay.
Figure 4. (a) The proportion of settled Halophila stipulacea fragments in time after tethering. (b) Production per fragment per day of the different plant parts (shoot, leaf, root) and total biomass (median and variation, n = 24).