Figures & data
Table I. Description of data on phytoplankton used in this study with information on collection year, sampling station, methods, references and the time of ice retreat.
Table II. Description of data on zooplankton used in this study with information on collection year, sampling station, methods and references.
Figure 1. Temperature and time (day of year) of the spring bloom peak at Tvärminne Storfjärden. Temperature is the average seawater temperature between 0 and 10 m in April (temperature for 1997 is missing).
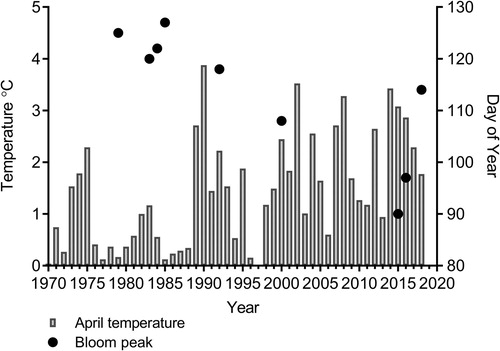
Figure 2. Annual time series of Chlorophyll a in the Tvärminne region, Southwestern Finland, based on data retrieved from publications listed in .
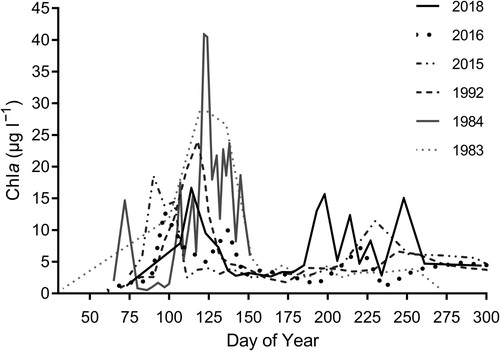
Figure 3. Time integrated biomass for spring and summer blooms in the Tvärminne area. Bloom conditions were defined as Chl a concentration exceeding 3 μg l−1. The spring bloom was defined as the period starting in March when Chl a uninterruptedly exceeded the threshold, i.e. one peak. The summer bloom included multiple peaks between June and October after which Chl a did not exceed the threshold. The biomasses of these peaks were pooled into one summer bloom. In 1983 Chl a did not exceed the threshold after the spring bloom. (* indicates missing summer data).
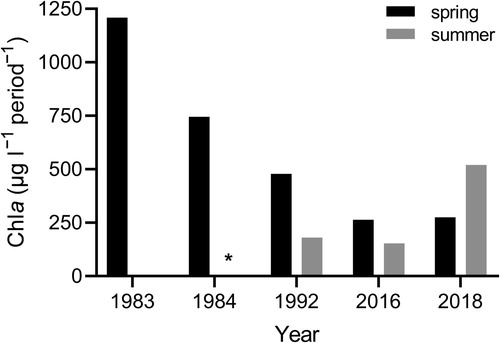
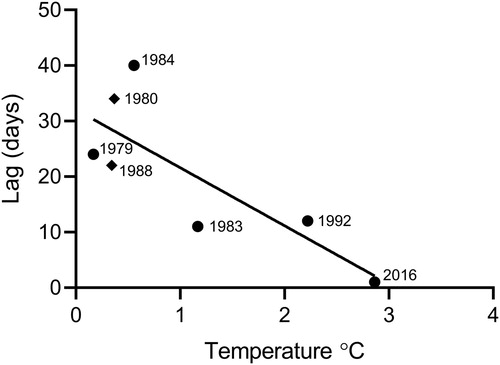
Figure 4. Time lag (days) between phytoplankton and zooplankton biomass peaks against average seawater temperature in April in Tvärminne (●Storfjärden and ◆Storgadden).