Figures & data
Figure 1. Study site, mean monthly (seasonal) variation of shoot structure (leaf length, number of leaves) and investigated leaf segments. (A) Picture of the investigated meadow (Valsaline; Pula; Croatia; 44°50′59.6″N, 13°50′10.0″E) and ‘space competition’ on leaves shown by a sessile Polychaeta, which is overgrown by Corallinaceae. (B) Monthly variation of shoots for the shallow and deep site. Numbers (1–4) indicate other leaves, beside the old (O) and young (Y). (C) One representative shoot (July at 5 m): basal (blue), central (orange), apical (grey).
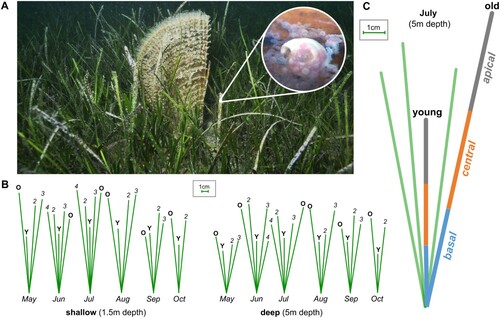
Figure 2. (A) Relative occurrence (log-scaled) of autotrophic and heterotrophic epibiota for each segment collected in the shallow transect (1.5 m depth). Relative occurrence in per cent for epiphytes on young (B) and old (C) leaves from apical (grey), to central (orange) and basal (blue) in shallow water. (D) Representative organisms found in the transect. Abbreviations of single taxa are ordered from bottom to top according to relative occurrence values in per cent. Abbreviations: bryozoan (bry), Ceramium (cer), Clytia linearis (cly), Corallinaceae (cor), Kirchenpaueria pinnata (kir), Pachycordyle pusilla (pach), Polychaeta diverse (pol), Rhodophyta diverse (rh), Tretomphaloides concinnus (tre). A detailed view on the relative occurrence of all other epibiota can be found in the Appendix (Figures S1, S3).
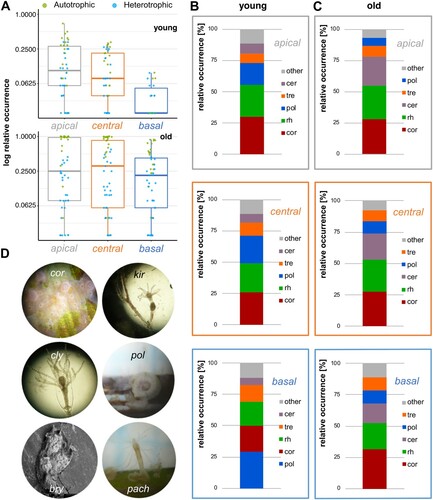
Figure 3. Seasonal occurrence frequency of (A) autotrophic and (B) heterotrophic epiphytes within the apical (grey), central (orange) and basal (blue) segment. Representative taxa for each group are shown in the figure: Ceramium spp. (A) and Clytia linearis (B).
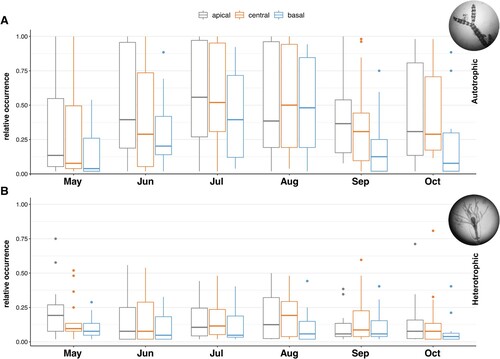
Figure 4. Seasonal occurrence frequency (log transformed) of epiphytes for different depths (A) and leafage (B) within the apical (grey), central (orange) and basal (blue) segment.

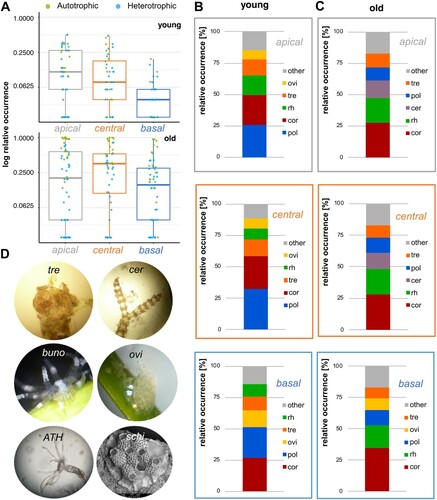
Figure 5. (A) Relative occurrence (log-scaled) of autotrophic and heterotrophic epibiota for each segment collected in the deep transect (5 m depth). Relative occurrence in per cent for epiphytes on young (B) and old (C) leaves from apical (grey), to central (orange) and basal (blue) in shallow water. (D) Representative organisms found in the transect. Abbreviations: Athecate Hydrozoan (ATH), Bunodeopsis strumosa (buno), Ceramium (cer), Corallinaceae (cor), Foraminifera (fora), gastropod clutches (ovi), Polychaeta diverse (pol), Schizobrachiella sanguinea (schiz), Tretomphaloides concinnus (tre). A detailed view on the relative occurrence of all other epibiota can be found in the Appendix (Figures S2, S4).