
Figures & data
Figure 1. Experimental overview of the temperature stress experiments (A) and the heavy metal bioconcentration experiment (B). Further details are found in the Materials and methods section.
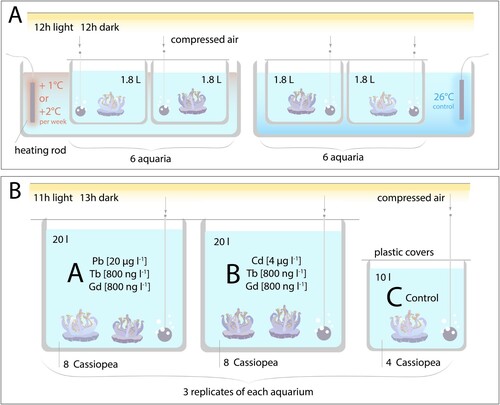
Figure 2. A and B: Normalized bell pulsation rates (BPR) for temperature-stressed Cassiopea andromeda medusae (A, C and E: temperature gradient: 2°C/week, B, D and F: temperature gradient: 1°C/week) in orange and control (const. temperature 26°C) in grey. C and D: Symbiont maximum quantum yield (Fv /Fm) of C. andromeda medusae. Points represent average of triplicate (panels A and B) or quadruplicate (C and D) measurements for six replicate medusae at each time point with error bars representing the standard error. Shaded areas denote temperature recordings for both conditions. Measurement days on which the experimental group was significantly different from the control (unpaired one-sided t-test P < 0.05) are marked with an asterisk. E and F: C. andromeda wet weight normalized to initial weight, temperature stressed medusae (E: 2°C/week, F: 1°C/week) in orange and control (const. temperature 26°C) in grey. In all panels the vertical orange dashed line indicates the day of final ‘observation’ on which all 6 (experiment 1) or 3/6 (experiment 2) were found dead in the aquaria.
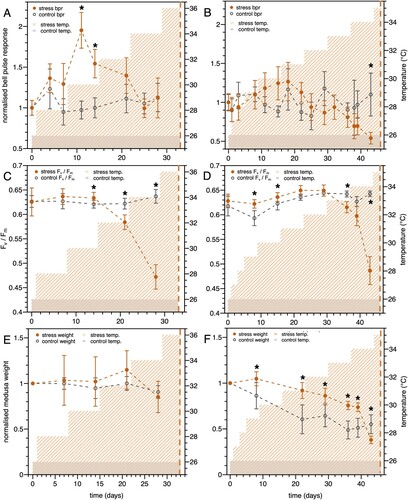
Figure 3. The same individual of Cassiopea andromeda after three days exposure to 33°C (1st row) and 34°C (2nd row).
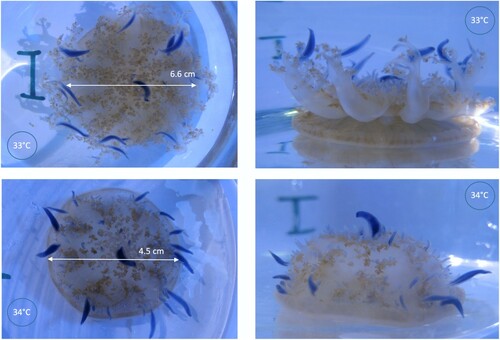
Figure 4. Bioconcentration of C. andromeda exposed to heavy and rare-earth metals. A: cadmium (Cd; green circles) or lead (Pb; purple circles); B: terbium (Tb; squares) and gadolinium (Gd; triangles) added with either Pb (purple) or Cd (green) in Cassiopea andromeda over time following exposure at day 0. Points and error bars represent average tissue concentrations and their standard deviations measured for triplicate organisms, respectively. Bioconcentration factors (BCF) refer to increases in concentrations in jellyfish divided by the bulk water concentrations after 7 days.
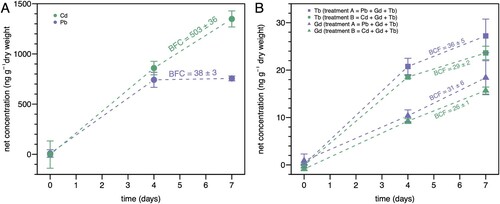
Table I. Bioconcentration factors of spiked metals in Cassiopea andromeda.Table Footnotea
Data availability
The authors confirm that the data supporting the findings of this study are available within the article, or are available from the corresponding author, P.B., upon reasonable request.