Figures & data
Figure 1. Chthamalus dentatus from Southern Africa. A. Young specimen from Port Elizabeth, South Africa. B. Eroded specimens from Mowe Bay, Namibia. C. Cylindrical specimen from Mowe Bay. D. Specimen from Port Elizabeth.
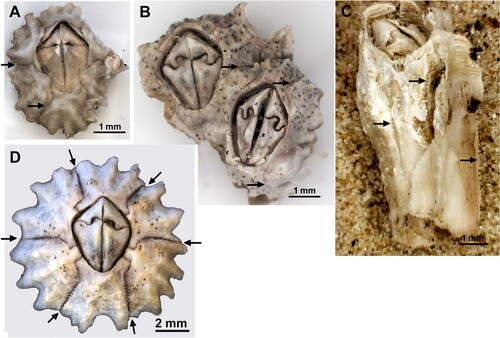
Figure 2. Chthamalus dentatus A. After Krauss (Citation1848), Table VI Figure 27. B. After Darwin (Citation1854), Plate XVIII a. Shell. 3b. Attached to a ship's bottom, general view showing the dentate margins of shell plates. 3c. Tergum viewed from inside. C. After Nilsson-Cantell (Citation1921), Page 293 Text Figure 52. D. After Stubbings (Citation1967), Page 255 f. Seta from the tip of cirrus II from a buoy at Bonny, Nigeria.
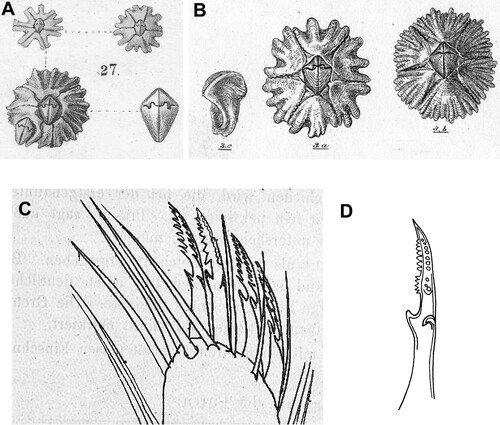
Figure 3. Map showing the 14 collection sites in Namibia, South Africa and Madagascar. The arrow points to the 15th site, Batoké in Cameroon, which is out off the map. Collection sites are coloured according to their clade identity (see Results): South African (blue), Namibian (red) and Cameroon (green).
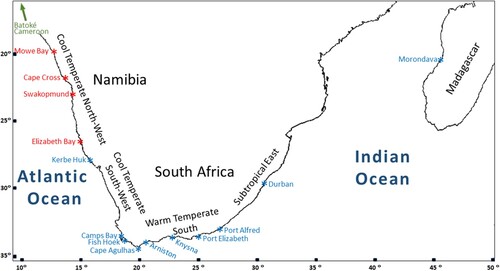
Table I. Number of individuals (N) from each population. Coordinates are rounded to the nearest minute.
Figure 4. An UPGMA tree depicting the relationship between the 14 Chthamalus dentatus populations. (CMR = Cameroon, MDG = Madagascar, NAM = Namibia, and RSA = South Africa).
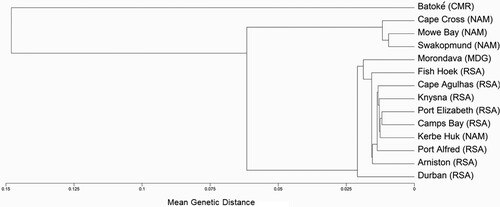
Table II. Mean genetic distances between the 14 sampled locations. The rightmost column displays the mean genetic distances within each location. Distances were calculated by the Kimura 2-parameter model.
Figure 5. The tri-modal distribution of all pairwise distances (with regard to the ABGD method).
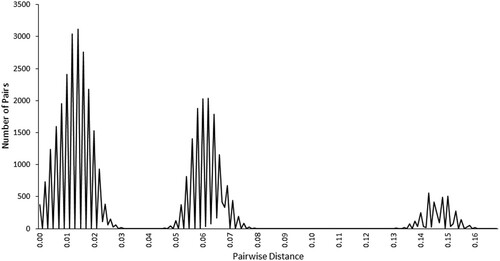
Figure 6. A median-joining haplotype network. The three clades are Cameroon (CMR), Namibia (NAM) and South Africa (which is further divided into three sub-clades – RSA1, RSA2 and Madagascar).
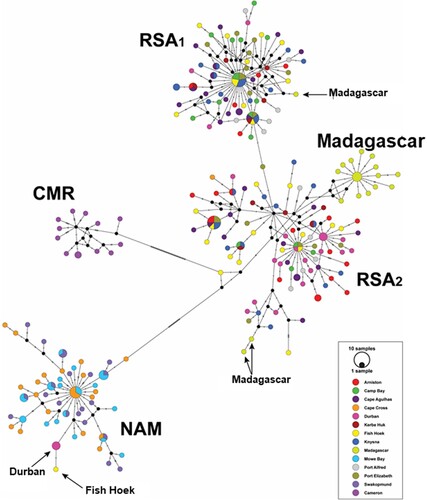
Figure 7. A neighbor-joining tree of Chthamalus dentatus individuals from the Atlantic coast of Africa. Individuals are from Cameroon, Camps Bay (representing the South African populations), Swakopmund (representing the Namibian populations), Kerbe-Huk and Elizabeth Bay. The percentage of replicate trees in which the associated taxa clustered together in the bootstrap test (1000 replicates) is shown only if larger than 90%.
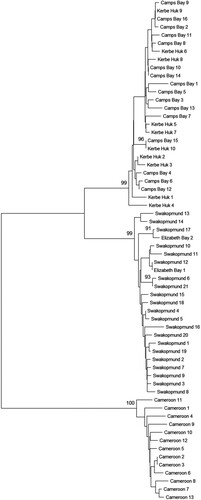
Table III. Mean genetic distances between the three Chthamalus dentatus and the four Chthamalus malayensis clades. Distances were calculated by the Kimura 2-parameter model.
Table IV. Mean genetic distance between the three Chthamalus dentatus clades and ten nominal species of Chthamalus. Distances were calculated by the Kimura 2-parameter model.
Figure 8. Photomicrographs of terminal segments of anterior rami of cirri II. A. Port Elizabeth, South Africa. B. Mowe Bay, Namibia. C. Morondava, Madagascar. D. Batoké, Cameroon.
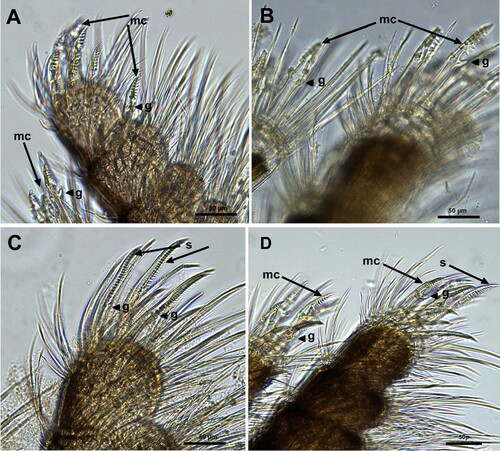
Figure 9. SEM photograph of terminal segments of cirrus II and isolated seta. A. Serrulate setae on the terminal segment of posterior ramus of cirrus II of the specimen from Morondava, Madagascar. Guards on seta are indicated by arrows. B. Terminal segments with multi-cuspidate setae with guards of the specimen from Batoké, Cameroon. C. Isolated setae from Mowe Bay, Namibia. D. Isolated seta from the terminal segment of the specimen from Port Elizabeth, South Africa. E. Isolated setae from Morondava, Madagascar. F–I. Isolated setae from the specimens from Batoké, Cameroon.
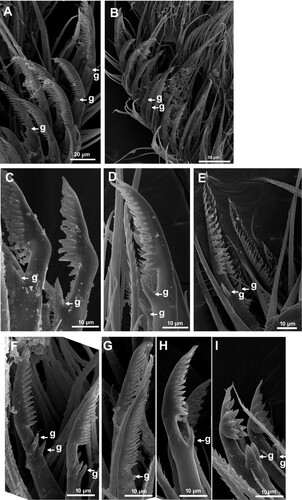
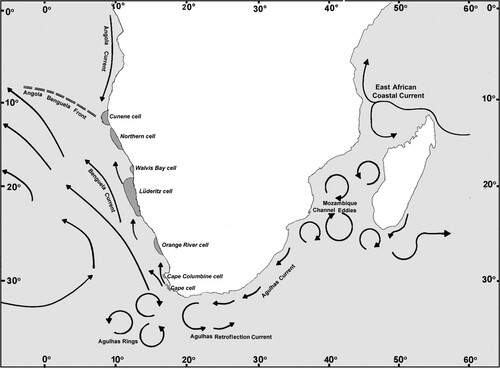
Figure 10. Map showing the major current systems and upwelling systems in the southeast Atlantic Ocean and the southwest Indian Ocean. Redrawn according to the maps by Hardman-Mountford et al. (Citation2003, ibid ) and by Lutjeharms and Bornman (Citation2010, ibid ). Grey zones along the coasts represent upwelling cells.