Figures & data
Figure 1. (A) The IMR annual shrimp survey area with depth zones shown in shades of grey. (B) The position of the 111 fixed bottom trawl stations from which bycatch data for the period 2017–2021 were used in this study (black dots), and the 35 localities that was visually mapped by OCEANA in 2016 and 2017 using ROV (Álvarez et al. Citation2019).
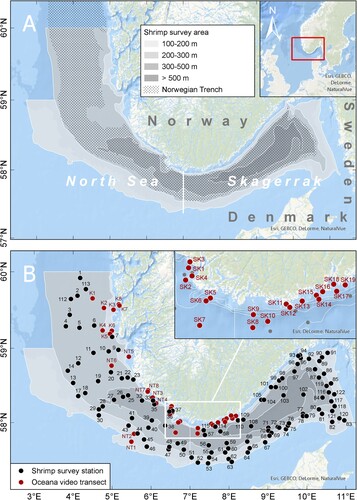
Figure 2. From each trawl catch at the annual shrimp survey the benthos bycatch was displayed on the sorting table in the fish-lab and photographed. Coral and sea pen species were identified, and numbers estimated based on the number of holdfasts or peduncles observed in the bycatch photos.
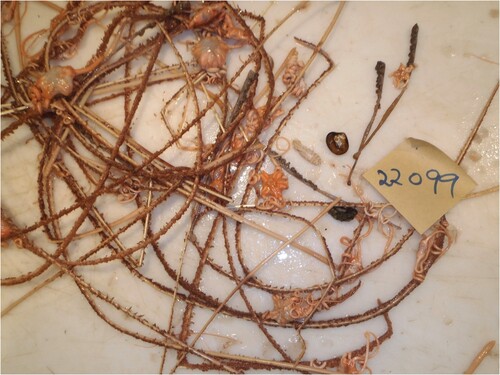
Table I. Station numbers (Stn.) and geographic position for the 111 fixed bottom trawl stations from which bycatches of sea pens and bamboo corals were recorded in the 5-year period 2017–2021 (see map in B).
Table II. Station information for the ROV localities visually mapped by the organization OCEANA (Álvarez et al. Citation2019) between 2016 and 2017, date, geographic position and station depth (m) (see map in B).
Table III. Data on bycatch in trawl hauls of sea pens and corals and the common symbiont on Funiculina, the ophiuroid Asteronyx. Number of trawl stations with bycatch, number of collected individuals and colonies, and maximum catch in a single trawl haul per survey year and total for all the years.
Figure 3. The distribution and abundance of the bamboo coral Isidella and the five sea pen species, Balticina, Funiculina, Kophobelemnon, Pennatula and Virgularia in the study area. For comparison, the bycatch numbers of the brittle star Asteronyx that is closely associated with Funiculina are also provided. Orange-brown circles show average number of colonies sampled per trawl station during the period 2017–2021 provided in three abundance ranges. Blue circles represent numbers of observed colonies at Oceana ROV stations provided in three ranges.
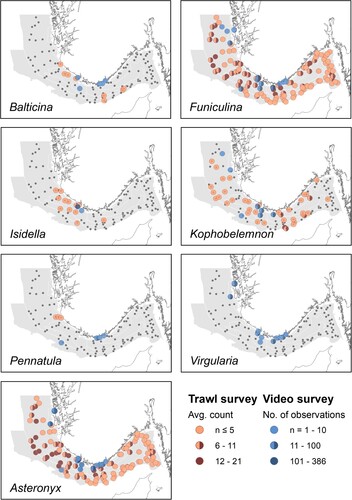
Figure 4. (A) Records of the sea pens Funiculina and Kophobelemnon and (B) Balticina and the bamboo coral Isidella, in different depth zones in the study area. Columns are the largest number observed at a station within the depth zone and lines are average for all stations in a depth zone.
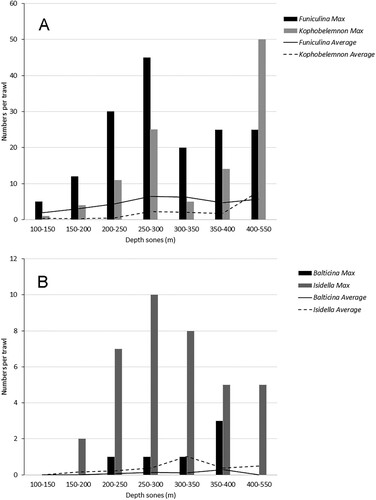
Figure 5. The relation between bycatch numbers for Asteronyx and its host Funiculina. R2 and the y value for the linear equation are provided. The equation shows that the relation between the brittle star and its host is close to one to one. The slightly larger value (1.1) indicates that a single colony can have more than one specimen attached, which is in line with ROV observations (see A).
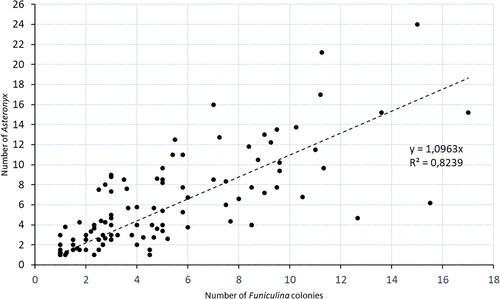
Figure 6. Funiculina was the most common sea pen in the trawl bycatches. (A) Photo from ROV transects conducted at station SK 6 showed high densities (∼3 colonies per m2) with the symbiont brittle star Asteronyx present on all colonies. (B) The sea pen predator anemone Ptychodactis patula was found eating tissue of the sea pen skeleton.
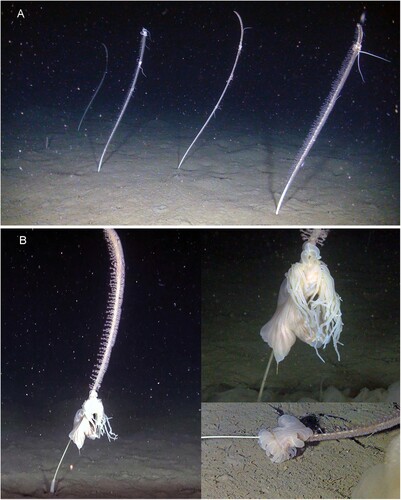
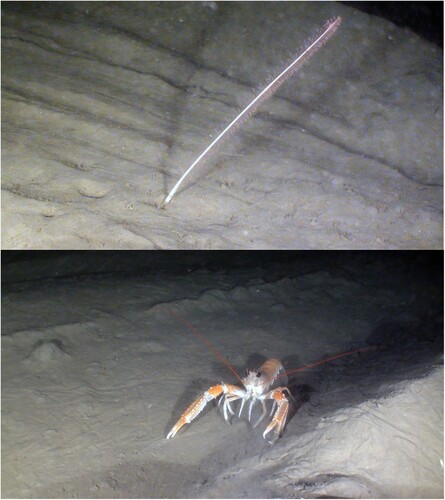
Figure 7. The bamboo coral Isidella lofotensis was documented in densities of several colonies per m2 on video from the ROV station SK2. As do many other gorgonians (laser scale (red dots) is 5 cm), Isidella provides a habitat that allows for other organisms, here a pandalid shrimp, to hide amongst the branches away from predators (photo from ROV station SK6).
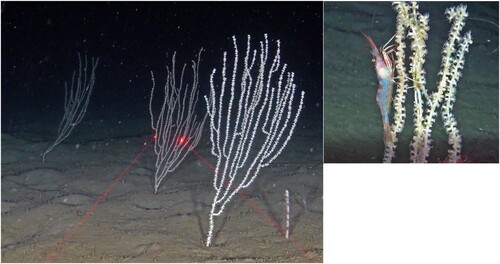
Table IV. The 17 ROV stations (out of 35) where observations of sea pens and corals were made.
Figure 8. Occurrences of sea pens (all species combined, whole area) and Isidella (inserted figure) in relation to bottom trawling intensity in the study area. Fisheries intensity is shown as the number of hours trawled per 5 × 5 km2 grid cell, using fisheries statistics for 2016–2020 provided by the Norwegian Fisheries Directorate, Open data: electronic reporting (ERS) (fiskeridir.no).
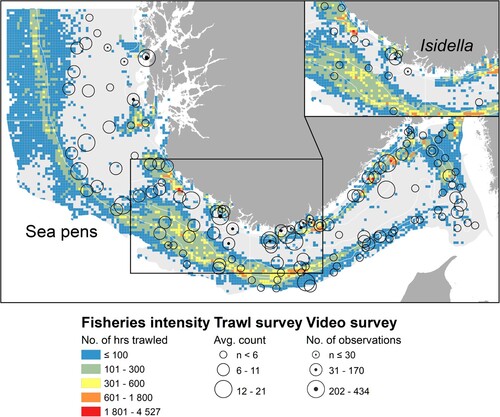
Figure 9. Relationship between trawling intensity (hours per grid cell) and total numbers of sea pens and Isidella sampled as trawl bycatch from the IMR shrimp survey from 2017–2021, and sea pens recorded on the OCEANA ROV stations in 2016 and 2017. Recorded colonies are provided as number per grid cell where trawl activity was also recorded (see ). The dotted trend line shows the relation between recorded number of colonies and fishing intensity.
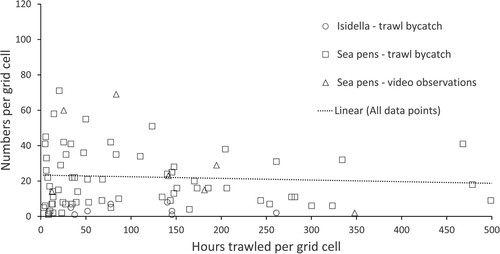
Figure 10. Damage to sea pens presumably from trawling at station SK2. At the top is a Funiculina skeleton and to the left below a colony with damaged tip of colony. At the bottom right are two Kophobelemnon colonies, the one in the back with damaged tip of colony.
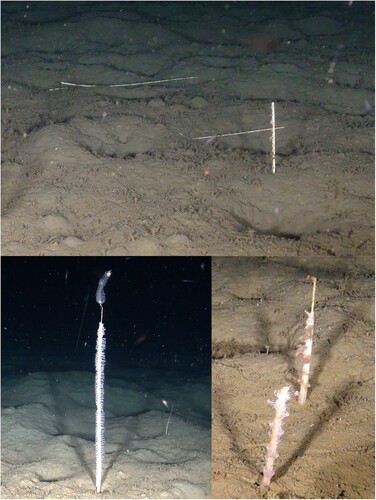
Figure 11. Trawl marks at station NT2. At the top is a Funiculina colony in front of lines from chain or bobbins. Below, is a squat lobster Nephrops norvegicus in between trawl marks.