Figures & data
Table I. Sampling sites and conditions for the three heterotrophic nanoflagellates investigated in this study.
Figure 1. Light and scanning electron micrographs of Ancyromonas kenti strain KM086. Anterior is to top of page in all images. (A–C) Differential interference contrast images. (D–E) Phase contrast images. All cells viewed from dorsal/left side. Note that anterior flagellum is visible in some (B, D) but not other (A, C, E) images under both contrast enhancement systems. (F–I) Scanning electron microscope images. Panels F–H show cell’s ventral/right aspect; panel I is a dorsal/left view. Note groove (most clearly visible in F, G, I) and extrusomes (seen in typical aspect in G, more exposed and probably having discharged in H). Scale bars = 5 µm for panels A–E; 2 µm for panels F, G, I; 1 µm for panel H. AF: anterior flagellum, PF: posterior flagellum, arrowhead: rostrum, diamond: extrusomes.
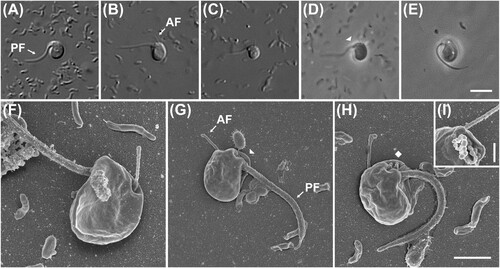
Figure 2. Maximum likelihood phylogenetic tree inferred from 18S rDNA sequences of ancyromonads, including representatives of all cultured Ancyromonas strains as well as A. kenti strain KM086, and all available environmental sequences corresponding to A. kenti. Note that, although the sequences attributed to A. kenti strains 3b and edm11b do differ minimally, the two names actually refer to the same culture (see text for details). Ultrafast bootstrap support values (>95%) are shown at nodes. Solid circles indicate Bayesian posterior probability of 1.
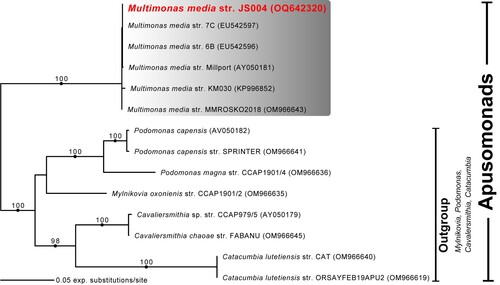
Figure 3. Light and scanning electron micrographs of Cafeteria mylnikovii strain JS001. (A–D) Differential interference contrast images. (E–F) Phase contrast images. Anterior is to right of page in all images. (G–H) Scanning electron microscope images. (G) Dorsal/right view. (H) Ventral/left view. Anterior is to top of page in both panels. Note mastigonemes (hairs) on anterior flagellum in both images, and ventral groove in H. Note also ‘crossing over’ of anterior and posterior flagella. Scale bars = 5 µm for panels A–F, 3 µm for panels G–H. AF: anterior flagellum, PF: posterior flagellum, FV: food vacuole, star: hairs of anterior flagellum.
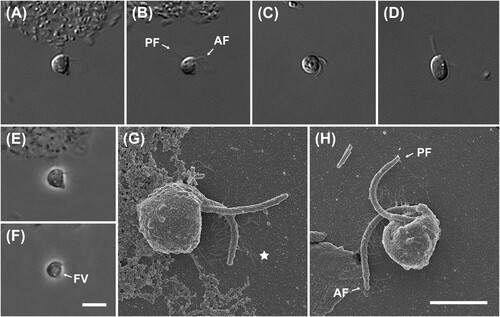
Figure 4. Maximum likelihood phylogenetic tree inferred from 18S rDNA sequences of members of genus Cafeteria, including C. mylnikovii strain KM086. Ultrafast bootstrap support values (> 95%) are shown at nodes. Solid circles indicate Bayesian posterior probability of 1.
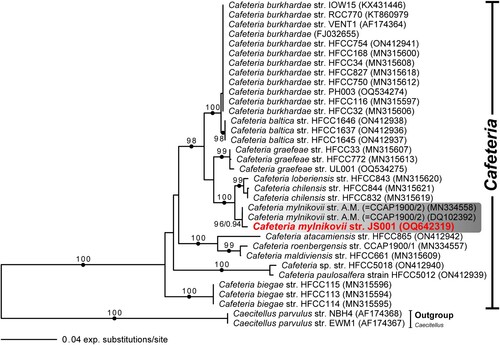
Figure 5. Light and scanning electron micrographs of Multimonas media strain JS004. (A–F) Differential interference contrast images. (G–J) Phase contrast images. Anterior is to top of page, and all cells are viewed from the dorsal side, in all light micrographs. Note long, thin trailing pseudopodium, superficially resembling flagellum but clearly tapering in B, E, I, J. (K–M) Scanning electron microscope (SEM) images. Anterior is to top of page in K, L; to left of page in M. K: Ventral view of cell. Skirt has wrapped around venter of cell, such that skirt margins are overlapping or adjacent, and ventral surface of cell and posterior flagellum are not visible. Note smooth margin of skirt (in contrast to ‘frilled’ edge noted in previous observations of M. media). L, M: Dorsal view of cell. Note prominent ‘crease’ in both images and dense proliferation of putative extrusomes posterior to ‘crease’ in L. However, note also complete lack of putative extrusomes in M. Scale bars: 5 µm for A–J; 2 µm for K–M. AF: anterior flagellum, PF: posterior flagellum, Ps: pseudopodia, FV: food vacuole, Ex: putative extrusome, Cr: crease, T: putative tusk, SF: skirt flange, Pr: proboscis, double arrowhead: sleeve.
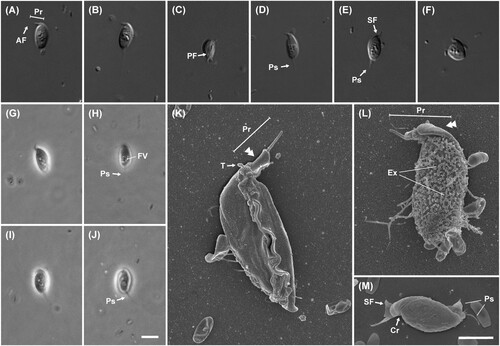
Figure 6. Maximum likelihood phylogenetic tree inferred from 18S rDNA sequences of genus Multimonas, including M. media strain JS004, with various other apusomonad genera as outgroups. Ultrafast bootstrap support values (> 95%) are shown at nodes. Solid circles indicate Bayesian posterior probability of 1.
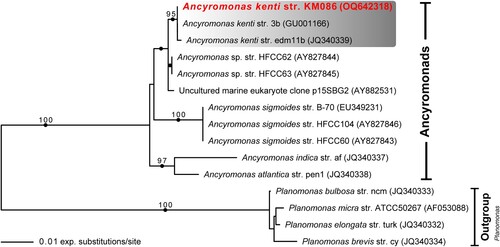
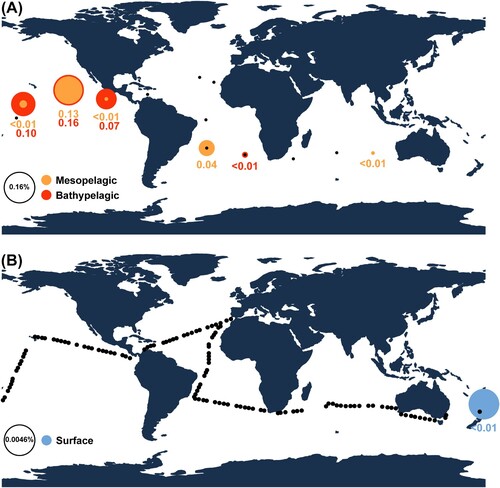
Figure 7. Global distribution pattern maps of two heterotrophic nanoflagellates, showing relative abundance of amplicon sequence variants (ASVs) of the V4 region of 18S rDNA, generated using the MicroMap web application (https://micromap.icm.csic.es/). (A) Two vertical depth profiles (mesopelagic and bathypelagic) of ASVs matching Ancyromonas kenti. (B) Relative abundance of ASVs matching Multimonas media at surface regions. Black circles indicate sampled sites with absence of the ASV.