Figures & data
Figure 1. Map showing the 10 collection sites of C. dentatus in the current study.
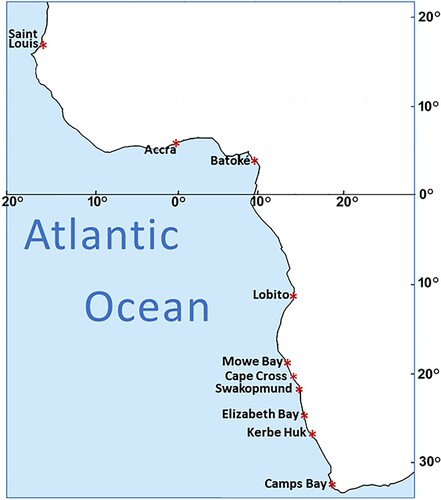
Table I. Number of individuals (N) from each population.
Figure 2. A UPGMA tree, based on between-location COI distances, depicting the relationship between the 10 Eastern Atlantic C. dentatus populations.
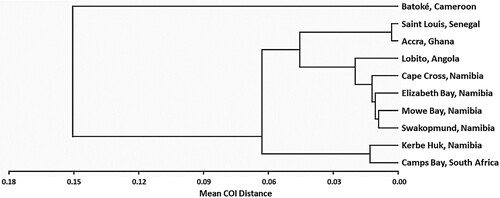
Table II. Pairwise COI distances between the 10 C. dentatus collecting locations. (Pairwise distance between any two locations, A and B, is the mean of all pairwise distances between two sequences, one from A and the other from B).
Figure 3. UPGMA trees depicting the relationship between the four Eastern Atlantic C. dentatus clades. (A) Based on between-clade COI distances, (B) based on between-clade D-loop distances, (C) based on between-clade EF1 distances, (D) based on between-clade NaKA distances.
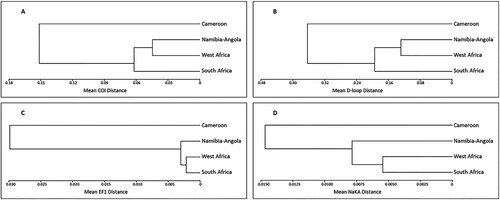
Table III. Pairwise genetic distances (± se) between the four Eastern Atlantic C. dentatus clades, for each of four markers.
Figure 4. A median-joining COI haplotype network. Black circles denote inferred medians.
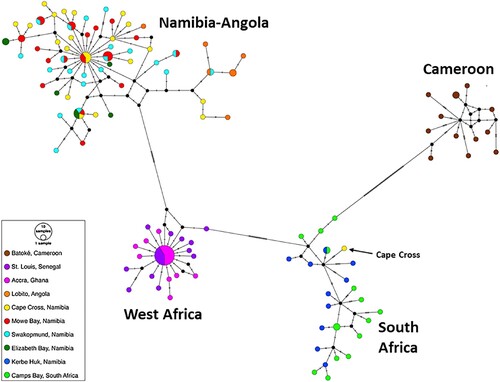
Figure 5. The distribution of all COI pairwise distances (with regard to the ABGD method).
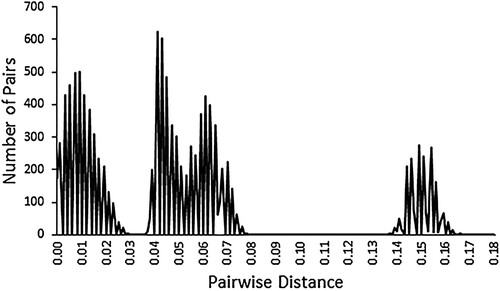
Figure 6. A D-loop-based neighbour-joining tree of C. dentatus individuals from the Atlantic coast of Africa. Pairwise distances between individuals were calculated by the Tamura-Nei model. The percentage of replicate trees in which the associated taxa clustered together in the bootstrap test (1000 replicates) is shown only if larger than 80%.
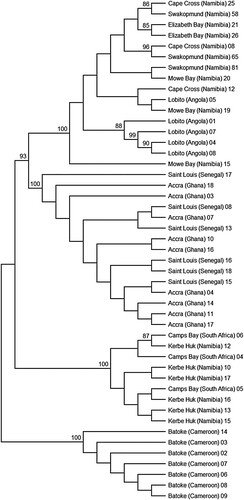
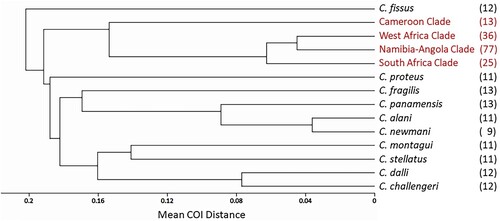
Figure 7. A COI-based UPGMA topology tree depicting the relationship between the four C. dentatus clades (in red) and ten different nominal species of Chthamalus. The numbers in parentheses refer to the sample size from each population.