Figures & data
Figure 1. Incorporation of algal 13C into bacterial fatty acids (µg 13C m−2) (sampling depth 0–12 cm) from the on-board incubations of 12, 30 and 132 h and the 32 h in situ experiments. The bars represent the mean value and the error bars depict the higher value of two replicates.
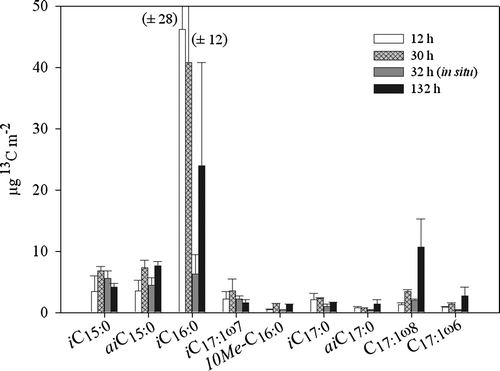
Figure 2. Incorporation (µg 13C m−2) into bacteria versus sediment depth from the on-board incubations of 12, 30 and 132 h and the 32 h in situ experiments. The bars represent the mean value and the error bars indicate the range of two replicates.
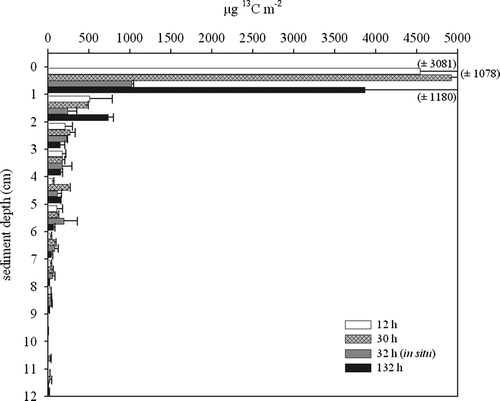
Figure 3. Total uptake (µg 13C m−2) of label into macrofauna versus sediment depth during the 12, 30 and 132 h on-board incubations and the 32 h in situ experiment. The bars indicate the mean value and the error bars depict the standard deviation.
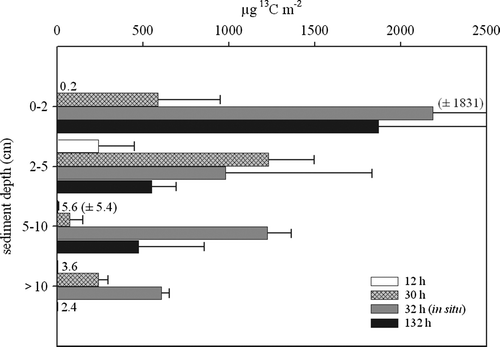
Figure 4. Release of 13CO2 to overlying water (µM) over time for the 12, 30 and 132 h on-board incubations. The symbols indicate the mean value and the error bars depict the range of two parallels.
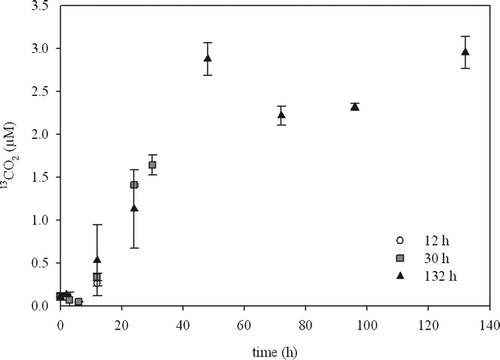
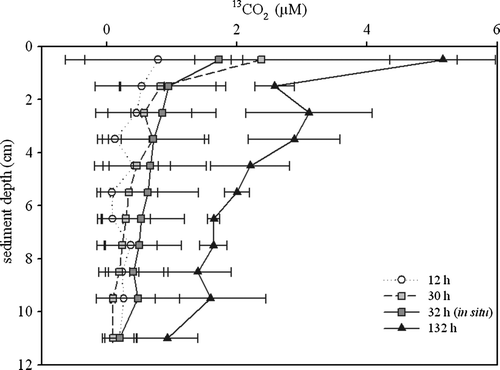
Figure 5. Porewater 13CO2 (µM) versus sediment depth of the 12, 30 and 132 h on-board incubations and the 32 h in situ experiment. The symbols indicate the mean value and the error bars depict the range of two parallels.