
Figures & data
Table 1. Barriers and enablers of waste minimisation in construction.
Table 2. Background information of respondents.
Table 3. Result of ANOVA of DoW factors.
Table 4. Result of the rotated component matrix of DoW barriers.
Figure 1. Full model of DoW in construction (algorithm result).
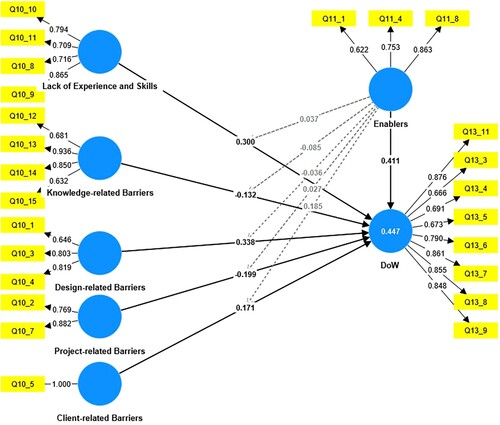
Table 5. Construct reliability, convergent validity, and discriminant validity.
Table 6. Predictive power result (PLSpredict).
Figure 2. Path coefficients results (bootstrapping results).
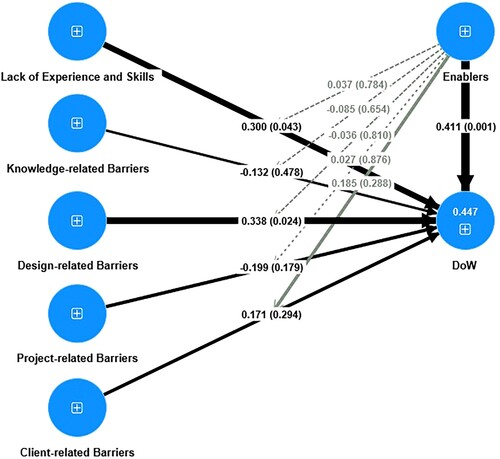
Table 7. Path coefficients, F-square, and collinearity (VIF) results.
Figure 3. IPMA results of exogenous constructs.
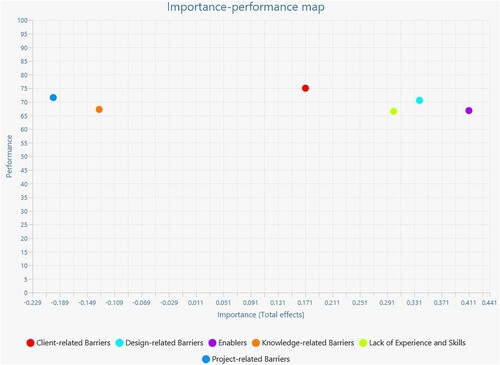
Table 8. IPMA results of indicators’ total effects and performance.