
Figures & data
Figure 1. ASLI can assign functionally graded lattice infills to randomly shaped 3D objects.
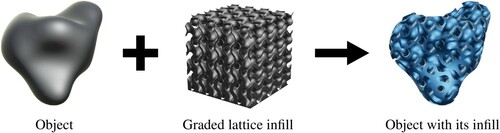
Figure 2. Schematic representation of the ASLI workflow. Users can provide the inputs either by modifying the configuration file or making use of the graphical user interface. Moreover, they can chose between two different workflows, the Mmg workflow and the CGAL workflow, each with its own advantages and disadvantages.
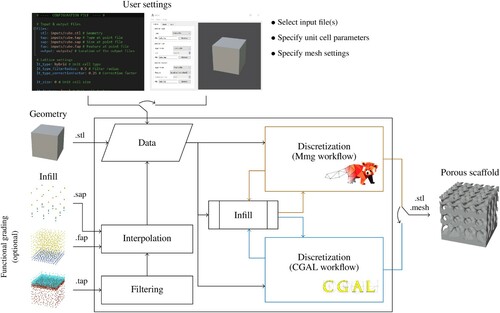
Figure 3. ASLI has six different unit cells already implemented, i.e. the (a) skeletal-gyroid, (b) sheet-gyroid, (c) skeletal-diamond, (d) sheet-diamond, (e) skeletal-primitive and (f) sheet-primitive.
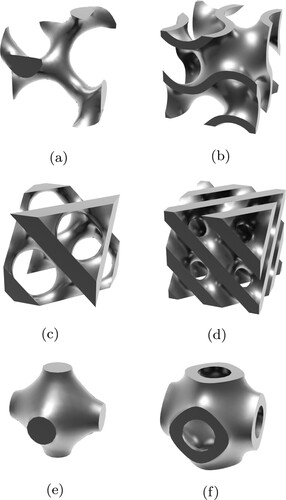
Figure 4. Graphical user interface of ASLI: (a) main interface with the lattice tab visible, (b) mesh tab and (c) run tab.
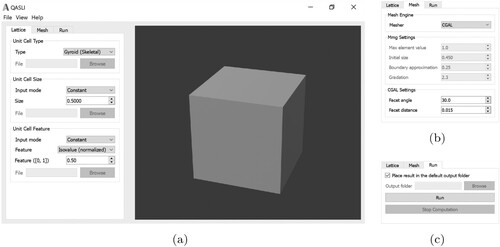
Figure 5. ASLI can generate hybrid, pseudo-periodic and heterogeneous infills by specifying the unit cell type, size and feature at different points throughout the volume: (a) input STL geometry, (b) specified types with resulting hybrid lattice, (c) specified sizes with resulting pseudo-periodic lattice, and (d) specified feature values with resulting heterogeneous lattice.
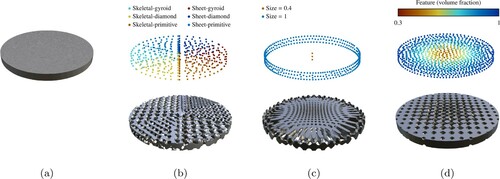
Figure 6. The performance of ASLI as determined with a skeletal-gyroid: (a) meshing times, (b) interpolation slowdown, (c) memory consumption and (d) parallel speed-up.
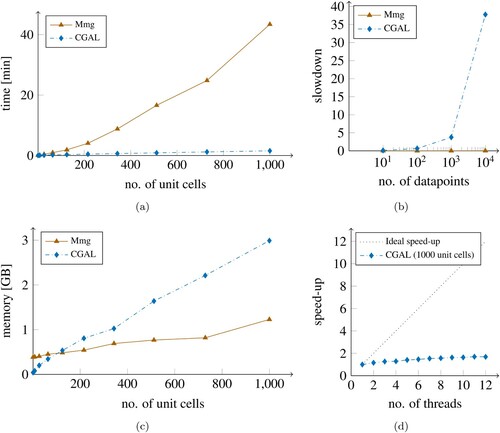
Figure 7. Performance comparison between the different freeware and free-and-open-source tools as determined with a skeletal-gyroid.
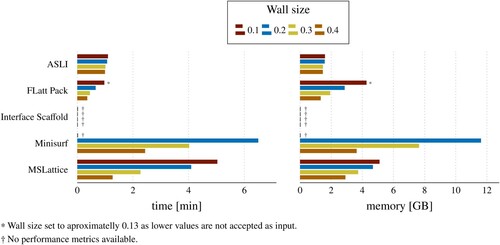
Figure 8. The shell of an acetabular implant was assigned a skeletal-gyroid infill of varying volume fraction to match a desired stiffness distribution: (a) ASLI generated 3D-model overlaid with the material stiffness distribution (b) additively manufactured acetabular shell.
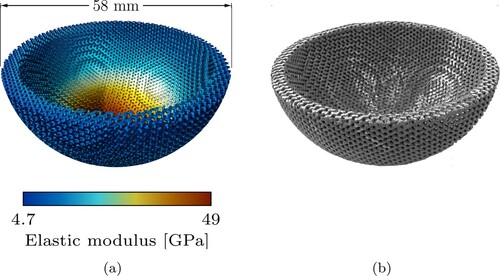
Figure 9. ASLI generated 3D-model of a femoral implant with a graded lattice where unit cell type, size and isovalue are varied. The top half of the lower section of the implant has been hidden to also show the internal structure. The transition between three different lattice types can be seen to happen smoothly in the close-up.
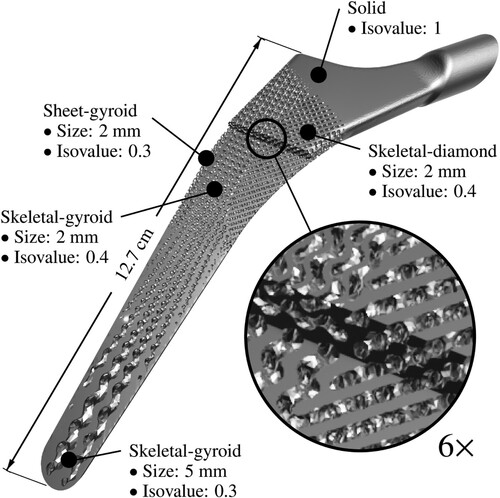
Figure 10. Volume meshes generated by ASLI can be used in finite element simulations: (a) volume mesh of a cylinder provided with a skeleton-primitive infill and (b) FE simulation result. One quarter of the cylinder has been hidden to show internal structure and stresses.
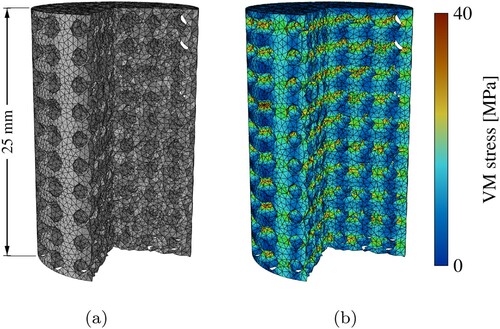
Table 1. Overview of tools (Maskery et al. Citation2022; Dinis et al. Citation2014; Hsieh and Valdevit Citation2020; Al-Ketan and Abu Al-Rub Citation2020; NTopology Citation2021; McNeel et al. Citation2021; Synopsys Citation2021) for the generation of TPMS-based lattices.
Figure A1. To estimate the volume fraction, wall size and pore size of the unit cells, their geometry was approximated on an increasingly refined grid until the desired accuracy was reached. The skeletal-gyroid unit cell, with a volume fraction of 0.5, is here shown for the intermediate grid. The solid side skeletal graph and void side skeletal nodes were used to aid in the virtual measurements.
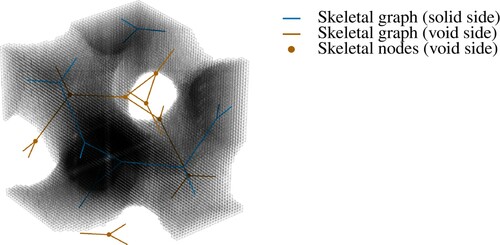
Figure A2. Virtually measured volume fraction, wall size and pore size for gyroid, diamond and primitive unit cells with corresponding polynomial fits.
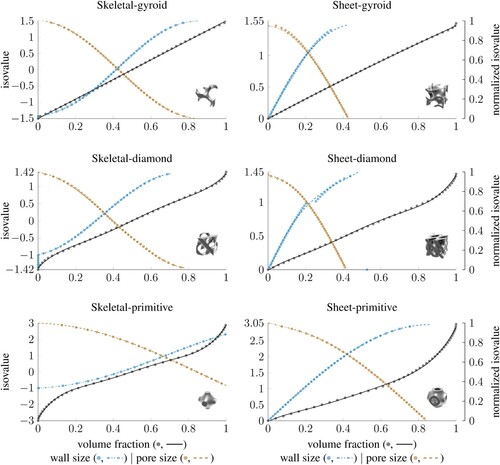
Figure A3. Discretisation errors of virtually measured volume fraction, wall size and pore size for gyroid, diamond and primitive unit cells.
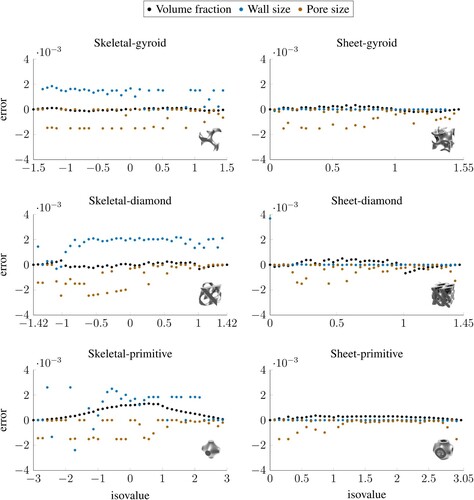
Table A1. Coefficients of the fitted polynomials.
