
Figures & data
Figure 1. MJF printing of GF/PA12 composites with bioinspired mechanical anisotropy.
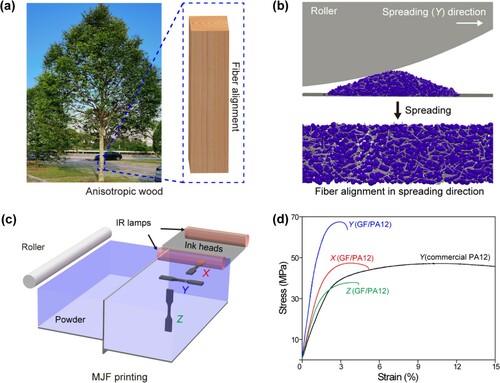
Figure 2. SEM images (a–c) and length distributions (d–f) of Fibre-124, Fibre-226, and Fibre-271.
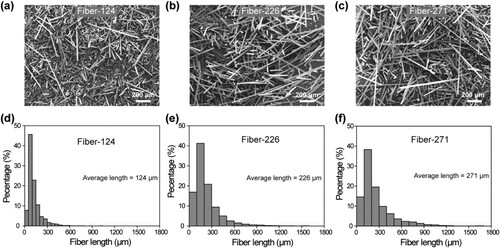
Figure 3. Avalanche angle distributions, median avalanche angles (Am), and bulk densities (Db) of Powder-124 (a), Powder-226 (b), and Powder-271 (c).
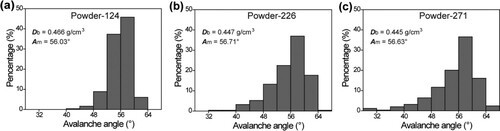
Figure 4. Thicknesses of different specimens prepared at layer thickness = 90 μm (a) and lamp speed = 16 inch/s (b).
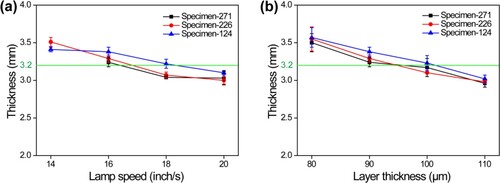
Figure 5. Porosity of different specimens: layer thickness = 90 μm (a); lamp speed = 16 inch/s (b).
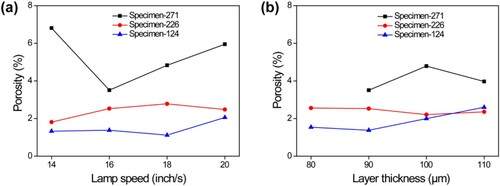
Figure 6. TGA (a) and DSC (b) curves of Specimen-271, Specimen 226, and Specimen-124.
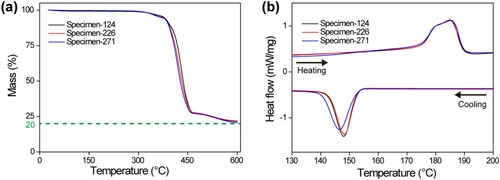
Figure 7. Optical microscope images of polished X-Y, Y-Z, and X-Z planes in Specimen-124 (a–c), Specimen-226 (d–f), and Specimen-271 (g–i).
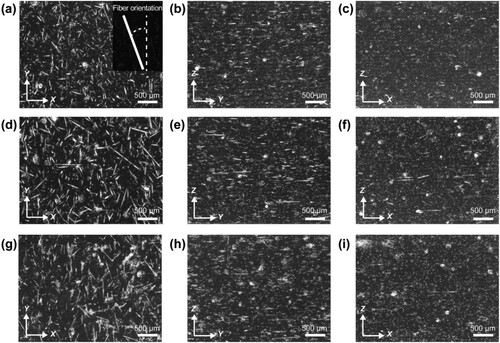
Figure 8. Fibre orientation in the polished X-Y planes of Specimen-124 (a), Specimen-226 (b), and Specimen-271 (c).
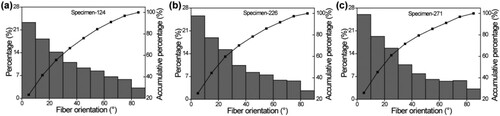
Figure 9. Simulated composite powder beds with different types of GFs: (a) Powder-124, (b) Powder-226, and (c) Powder-271 and the percentage of fibres orientated along the powder spreading direction within 20° versus the fibre length.
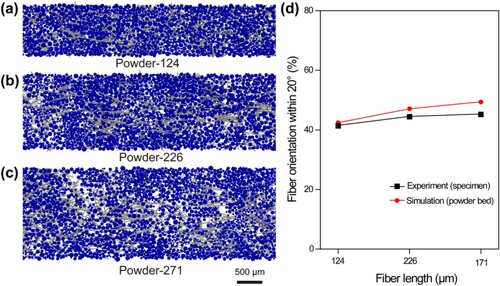
Figure 10. SEM images of the fractured surfaces of Specimen-124 (a–c), Specimen-226 (d–f), and Specimen-271(g–i) (the lamp speed = 16 inch/s; the layer thickness = 90 μm) in the Z-, X-, and Y- orientation.
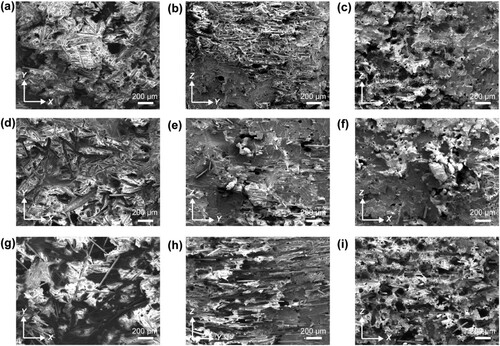
Figure 11. Mechanical properties of different specimens (a, c, and e: layer thickness = 90 μm; b, d, and f: lamp speed = 16 inch/s) in the Y-orientation.
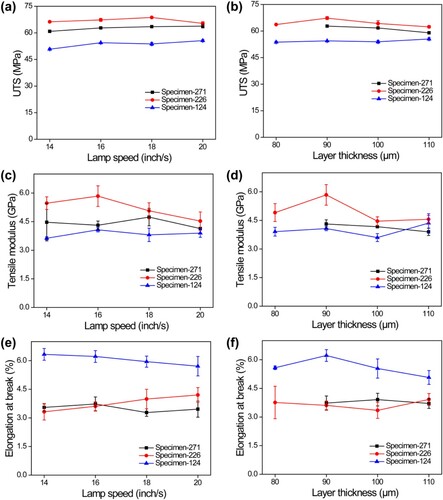
Table 1. Mechanical properties of different specimens (the layer thickness = 90 μm) in the Y-orientation.
Figure 12. Stress–strain curves (a–c), UTS (d), tensile modulus (e), and elongation at break (f) of Specimen-124, Specimen-226, and Specimen-271.
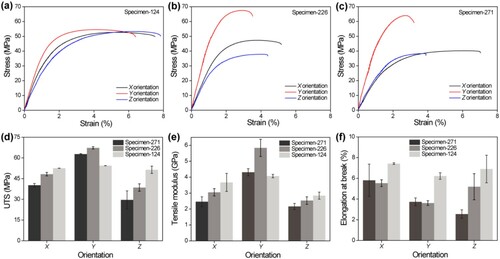
Table 2. Dependence of the mechanical properties of different specimens in the X- and Z-orientations (lamp speed = 16 inch/s; layer thickness = 90 μm).
Table 3. UTS and tensile modulus (in the powder spreading direction) of PA12-based specimens fabricated by SLS and MJF.