Figures & data
Figure 1. (a) The specific preparation process of GO-MoS2 nanocomposite powder. (b) The dispersion states of GO, MoS2, GM-1, GM-2 and GM-3 without PLLA in ethyl alcohol before and after 48 h at stationary conditions. (c) The micro morphologies of GO, MoS2, GM-1, GM-2 and GM-3 powder under SEM.
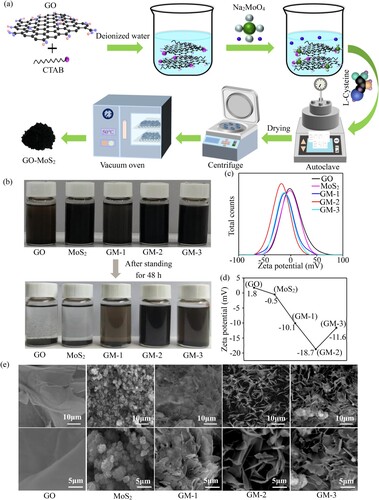
Figure 2. TEM images at different magnifications, HERTEM images and EDS mapping images of pure GO (a1-a4), pure MoS2 (b1-b4), GM-1 (c1-c4), GM-2 (d1-d4) and GM-3 (e1-e4) powder.
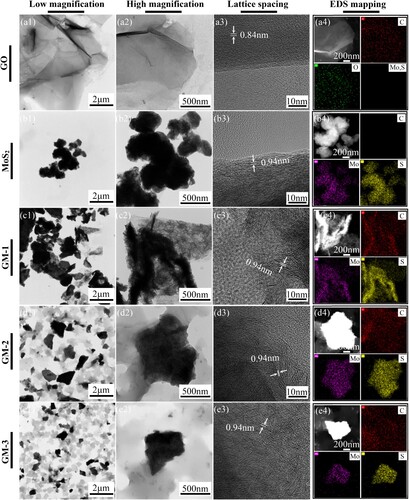
Figure 3. (a) The full-scan XPS spectra of GO, MoS2 and GO/MoS2 powder. (b) The narrow scan spectra of Mo3d in GO/MoS2 powder. (c) The narrow scan spectra of S2p in GO/MoS2 powder. (d–e) Raman spectra of GO, MoS2 and GO/MoS2 powder. (f) XRD spectra of GO, MoS2, GM-1, GM-2 and GM-3 powder.
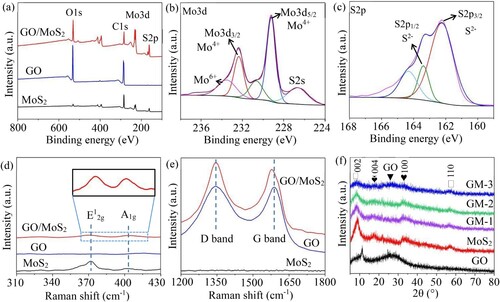
Figure 4. The mechanism diagram of the MoS2 nanosheets in situ grown on both sides of GO nanosheets via CTAB-assisted hydrothermal process.
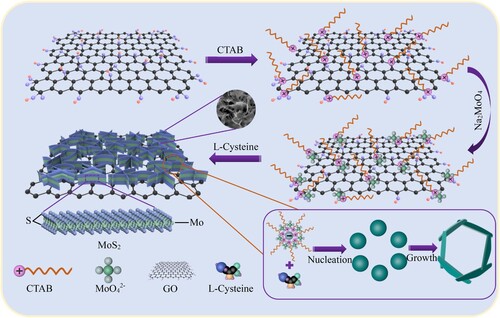
Figure 5. The morphologies of the PLLA (a), GM/PLLA powder (c) and their corresponding high magnified images (b, d). (e) The fabrication process of the GM/PLLA scaffold via SLS. (f) The top view of the scaffold. (g) The optical microscope (OM) image of the scaffold. (h) The SEM images of the surface of scaffold. (i-l) The EDS elemental mappings of C, O, Mo and S signals.
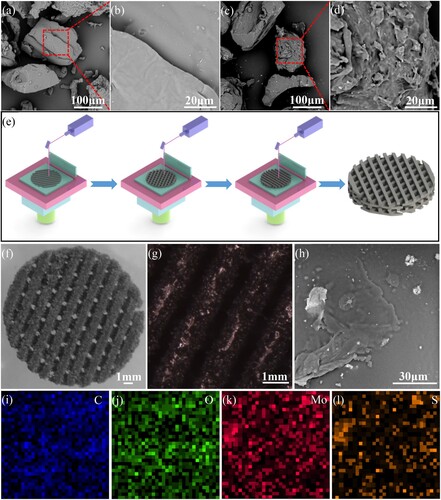
Figure 6. The dispersion states of the 1.5GO, 1.5MoS2, 1.5GM-1, 1.5GM-2 and 1.5GM-3 powder in the PLLA matrix under POM and SEM, respectively.
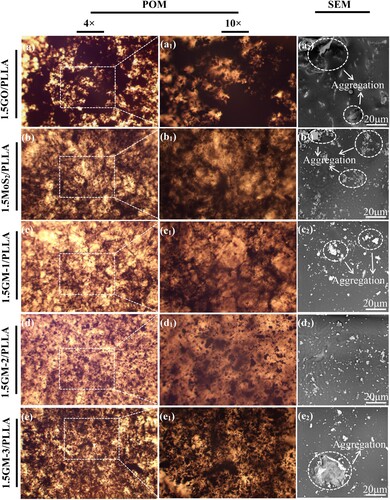
Figure 7. (a) The tensile specimens clamped with tongs of the universal testing machine. (b) The tensile specimens before and after tensile experiment. (c–d) The stress-strain curves, tensile strength and modulus of the PLLA, 1.5GO/PLLA, 1.5MoS2/PLLA, 1.5GM-1/PLLA, 1.5GM-2/PLLA and 1.5GM-3/PLLA scaffold specimens. * represents statistical difference (*p < 0.05, **p < 0.01) compared with the PLLA scaffold.
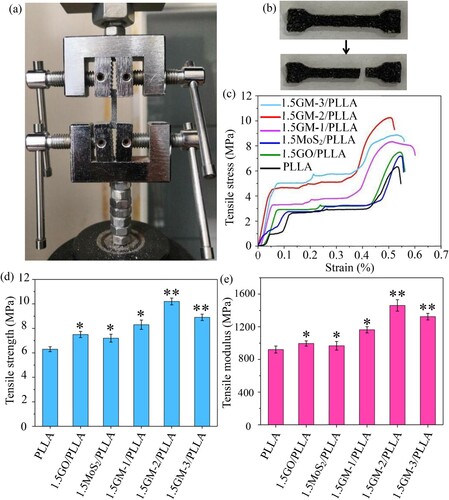
Table 1. Tensile strength of PLLA, GO/PLLA, MoS2/PLLA and GM-2/PLLA.
Figure 8. (a–f) SEM images of crack propagation in the 1.5GM-2/PLLA scaffold. (g) The corresponding crack propagation model.
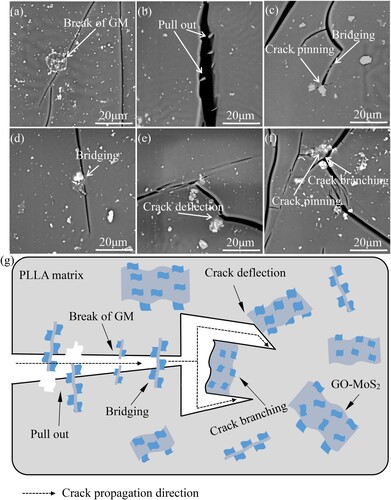
Figure 9. (a) Fluorescence images of MG-63 cells cultivated on the PLLA scaffold and 1.5GM-2/PLLA scaffold for 1, 3 and 5 d. (b) Live cells density of MG-63 cells cultivated on the PLLA scaffold for 1, 3 and 5 d. (c) Live cells density of MG-63 cells cultivated on the 1.5GM-2/PLLA scaffold for 1, 3 and 5 d. * represents statistical difference (*p < 0.05, **p < 0.01) compared with the PLLA scaffold or 1.5GM-2/PLLA scaffold at 1 d.
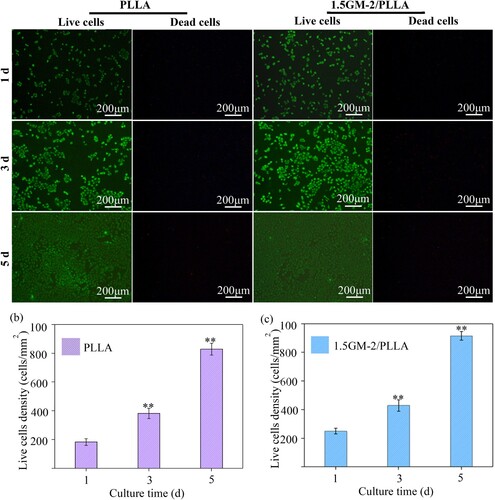
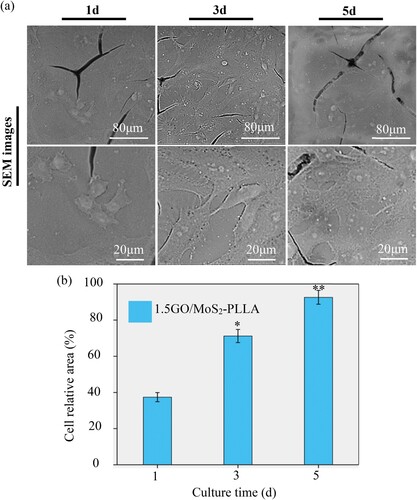
Figure 10. (a) SEM images of MG-63 cells cultivated on the 1.5GM-2/PLLA scaffold for 1, 3 and 5 d. (b) Cell relative area of MG-63 cells cultivated on the 1.5GM-2/PLLA scaffold for 1, 3 and 5 d. * represents statistical difference (*p < 0.05, **p < 0.01) compared with the 1.5GM-2/PLLA scaffold at 1 d.