Figures & data
Table 1. Chemical compositions (wt.%) of AlSi7Mg powder.
Figure 1. Schematic and photographs of the key components of the BL-DED system with the monitoring devices.
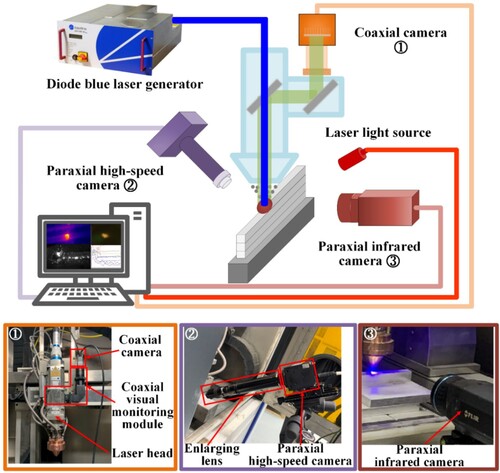
Table 2. Process parameter design of the single-layer single-track deposition.
Table 3. Process parameter and scanning strategy designs of the multi-layer single-track stacking.
Figure 2. Molten pool images obtained by the (a) coaxial camera, (b) paraxial high-speed camera, and (c) paraxial infrared camera and their region divisions in BL-DED.
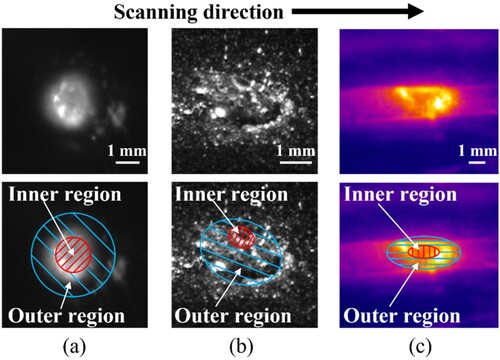
Figure 3. Metallurgical behaviours of the molten pool observed by the paraxial high-speed camera, (a) the molten pool image without enlarging lens, (b) image with a treble enlarging lens and the typical molten pool characteristics, (c) powders adhere to slags and do not melt absolutely, (d)∼(f) powders melt gradually with grayscale decreasing and move toward the inner region.
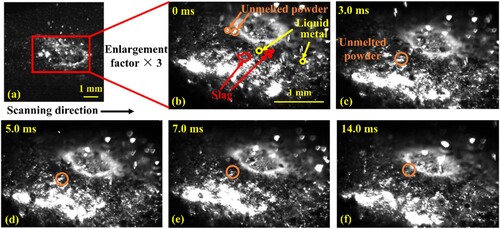
Figure 4. Metallurgical behaviours of the molten pool observed by the coaxial camera, (a) typical molten pool characteristics, (b)∼(f) the molten pool images at different times. Among (b)∼(f), (d) emerges the overexposure phenomenon due to the unmelted powder vaporizing or burning, and (f) shows the vaporizing or burning characteristic.
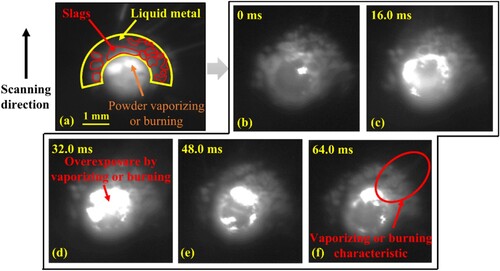
Figure 5. Molten pool images and typical deposition layer outlines with different process parameters: different inner and outer region characteristics and their relationships with deposition layer outlines.
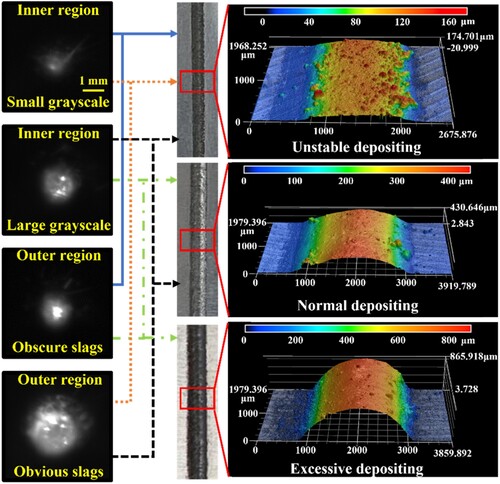
Figure 6. Molten pool images of different laser powers and scanning speeds with (a) 2.28, (b) 1.66, and (c) 1.03 g/min powder feed rate. In the images, orange, green, and blue backgrounds mean the unstable, normal, and excessive depositing states, respectively.
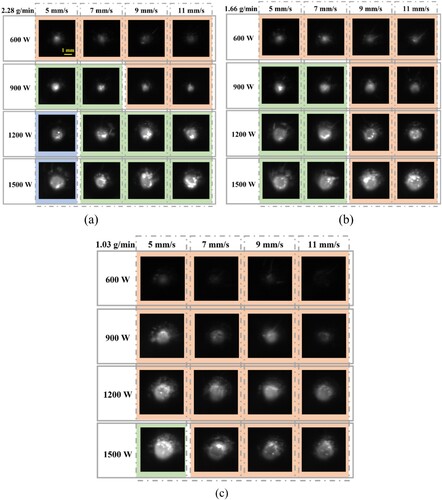
Figure 7. Influence of molten pool height on the two-dimensional shape of the slags and inner regions.
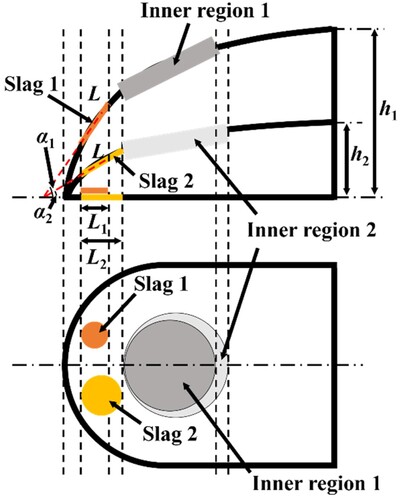
Figure 8. Different molten pool characteristics relying on the assistance of the high-speed camera with an enlarging lens and laser light source.
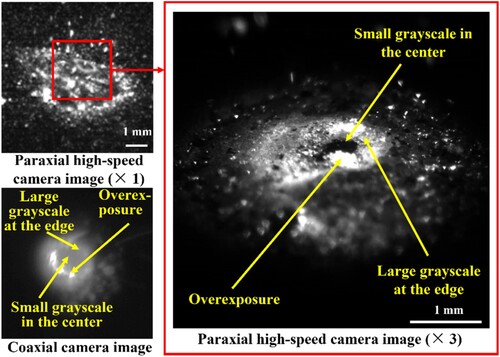
Figure 9. Molten pool characteristics of different laser powers, scanning speeds, and powder feed rates. The circle sizes represent (a) inner region area and (b) relative standard deviation of the inner region area, respectively.
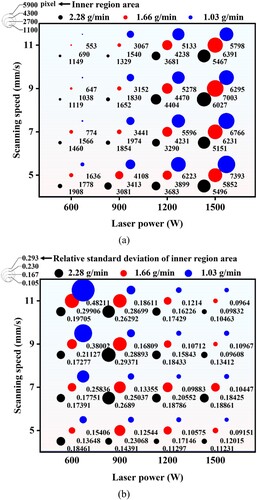
Figure 10. Distribution of Molten pool images which have different inner and outer region characteristics under different process parameters.
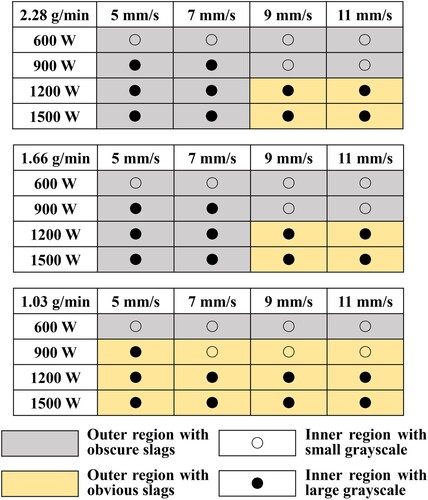
Figure 11. Molten pool images and inner region areas of different layers in multi-layer single-track stacking thin wall.
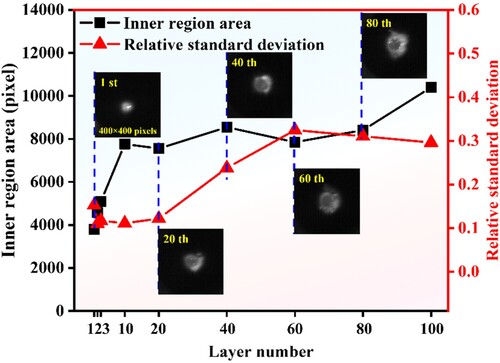
Figure 12. Four types of defects and their molten pool images in the multi-layer single-track stacking thin wall.
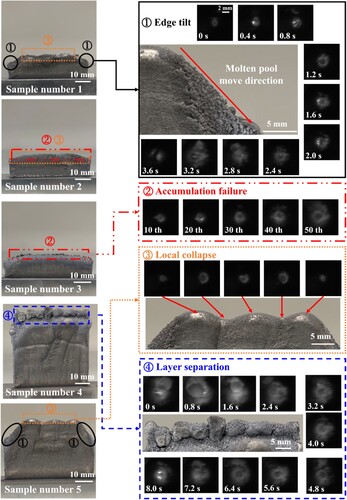
Figure 13. Recognition process of the unstable, normal, and excessive depositing states based on the molten pool characteristics in the single-layer single-track deposition layer.
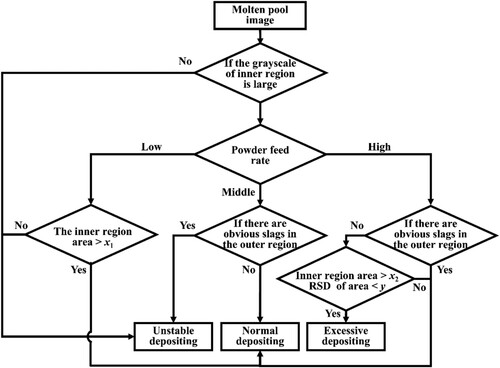
Figure 14. Real-time temperature of the molten pool when generating defects: (a) edge tilt and local collapse, (b) local collapse, (c) local collapse and deposition layer separation, (d) edge tilt and local collapse.
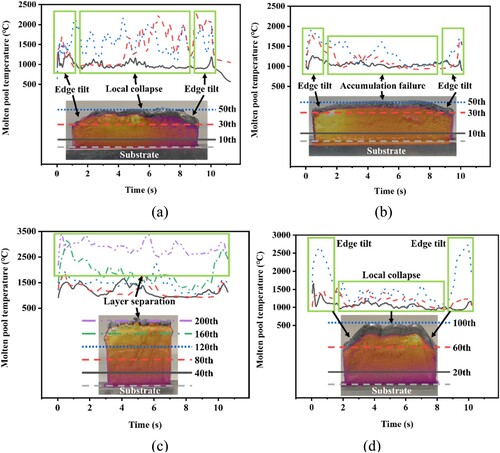
Figure 15. Variation trends of the molten pool temperature (MPT) and deposition layer temperature (DLT) in the fixed region with different defects. Sample number 1: edge tilt and local collapse; Sample number 2: local collapse; Sample number 4: local collapse and deposition layer separation; Sample number 5: edge tilt and local collapse.
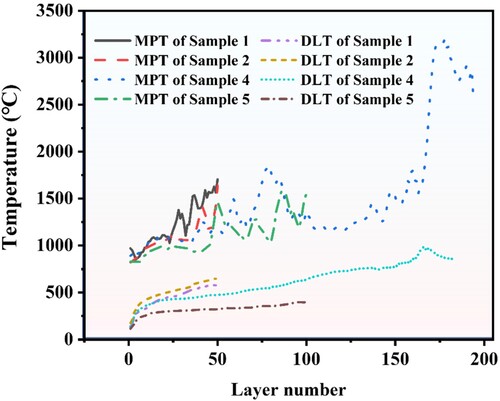
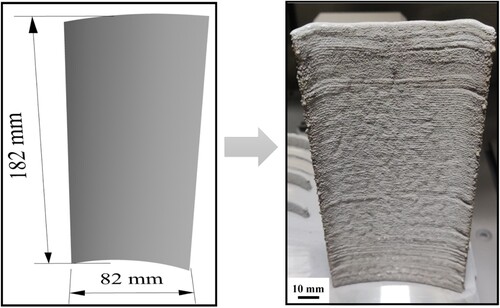
Figure 16. A fine thin wall produced by the blue laser through in-situ adjusting the defocusing amount