Figures & data
Figure 1. Basic TPMS: Schwarz P structure and Gyroid structure.
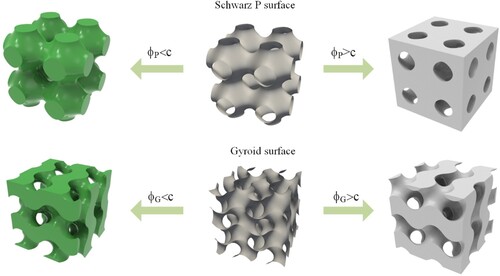
Figure 2. Period functions: (a) trigonometric function, (b) dual-period deformation function based on the trigonometric function, (c) sawtooth function, and (d) dual-period deformation function based on the sawtooth function.
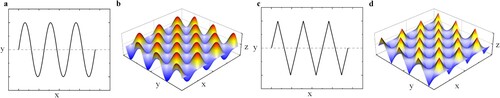
Figure 3. Bezier fitting curve: (a) three common points of different period functions, (b) two control points of the Bezier fitting curve, (c) period form of the Bezier fitting curve, (d) Bezier fitting curve with , (e) Bezier fitting curve with
, and (f) Bezier fitting curve with
.
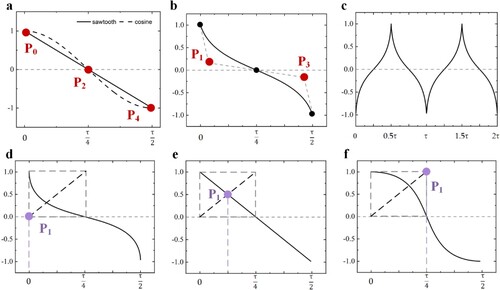
Figure 4. (a) 2D auxetic deformation method and evaluation of structural deformation degree, (b) orthographic views of the structure.
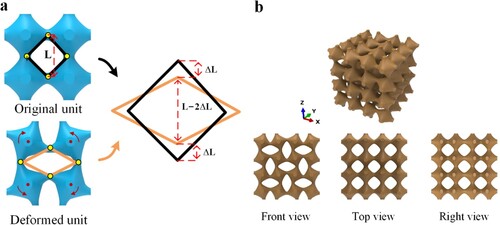
Figure 5. P-QA structure design method: (a) 3D auxetic deformation mechanism, (b) orthographic views of the P-QA structure.
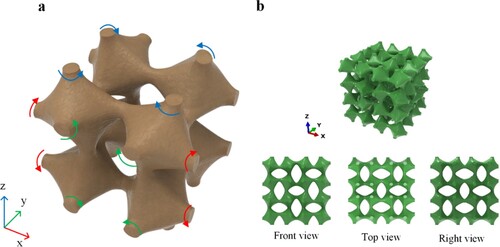
Figure 6. P-NA structure design method: (a) 3D auxetic deformation mechanism, (b) orthographic views of the P-NA structure.
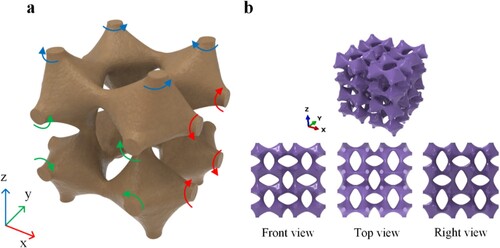
Figure 7. (a) stress-strain plots of the printed specimens, (b) measurement of Poisson's ratio in varied directions, and (c) measurement of Poisson's ratio during compression.
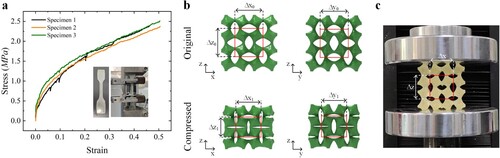
Figure 8. 2D auxetic deformation structure: (a) compression simulation deformation results, (b) measurement of sample deformation during compression using the DIC technique, (c) Poisson's ratio of the structure during compression.
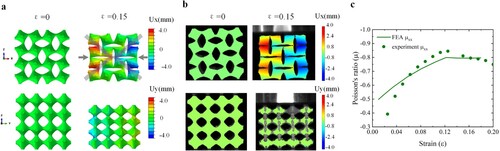
Figure 9. P-QA structure: (a) compression simulation deformation results, (b) measurement of sample deformation during compression using the DIC technique, (c) Poisson's ratio of the structure during compression.
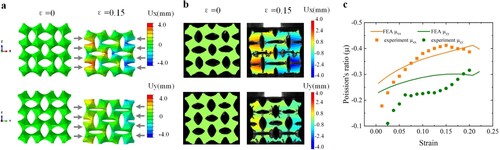
Figure 10. P-NA structure: (a) compression simulation deformation results, (b) measurement of sample deformation during compression using the DIC technique, (c) Poisson's ratio of the structure during compression.
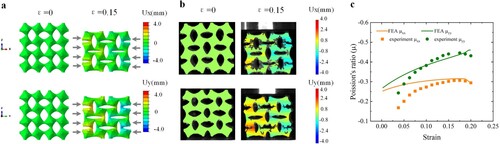
Figure 11. Deformation process of the P-NA structure during compression.
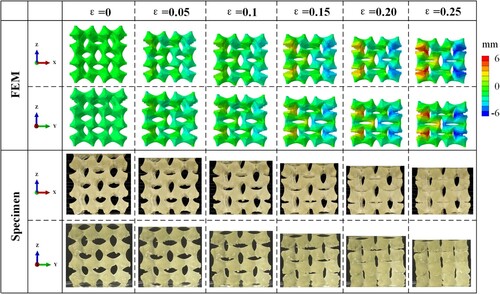
Figure 12. Stress-strain diagrams of varied auxetic structures: (a) 2D auxetic deformation structure, (b) P-QA structure, (c) P-NA structure.
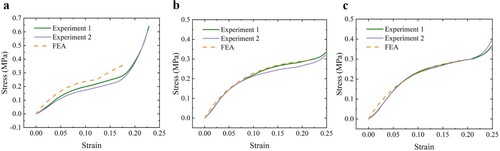
Figure 13. Poisson's ratio during compression of 3D auxetic structures: (a) structure P-QA with , (b) structure P-QA with
, (c) structure P-QA with
, (d) structure P-NA with
, (e) structure P-NA with
, and (f) structure P-NA with
.
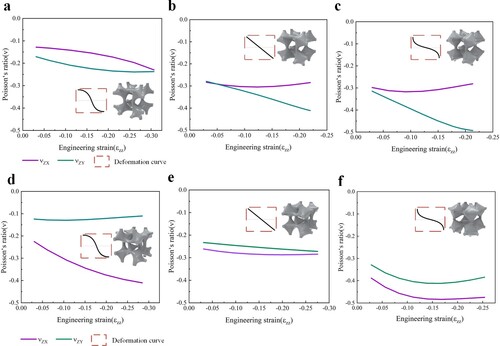
Figure 14. Deformation results of structures with different values of control index of the Bezier fitting periodic function.
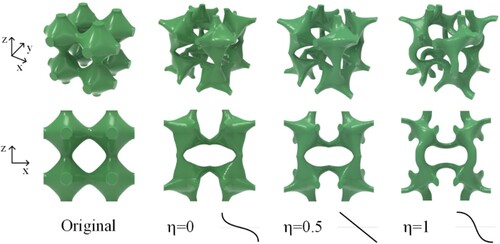
Figure 15. Variation of the relative density and volume-specific surface area of structures with control parameters: (a) when the variable is deformation index and (b) when the variable is control index
.
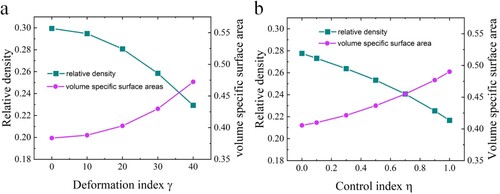
Figure 16. Mechanical properties of RVE: (a) relationship between and Poisson’s ratio
, relative elastic modulus E* of P-QA, (b) relationship between
and
, E* of P-QA, (c) relationship between
and
, E* of P-QA, (d) relationship between
and
, E* of P-NA, (e) relationship between
and
, E* of P-NA, (f) relationship between
and
, E* of P-NA, (g) polar diagram of
of P-QA, (h) polar representation of E* of P-QA.
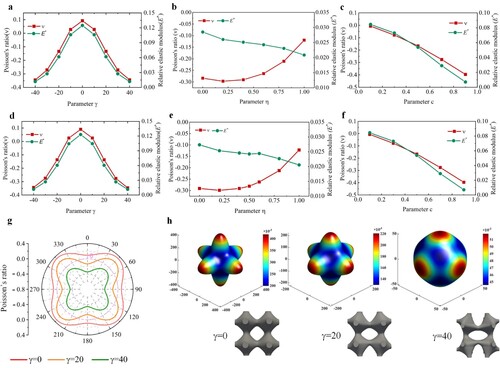
Figure 17. Relationship between mechanical properties and parameters in structure P-QA: (a) analysis results of relative elastic modulus and fitting surface, (b) analysis results and fitting surface of the Poisson’s ratio of the structure at 10% strain, and (c) comparison of the fitting surfaces of the Poisson’s ratio of the structure in ZX and ZY directions.
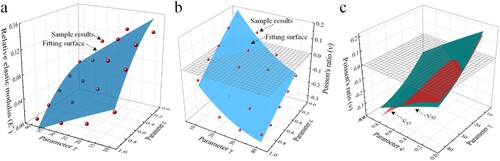
Figure 18. Relationship between mechanical properties and parameters in structure P-NA: (a) analysis results of relative elastic modulus and fitting surface, (b) analysis results and fitting surface of the Poisson’s ratio of the structure at 10% strain, and (c) comparison of the fitting surfaces of the Poisson’s ratio of the structure in ZX and ZY directions.
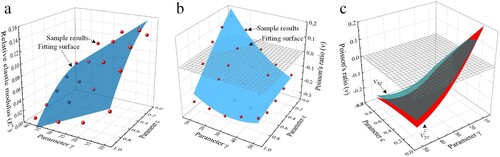
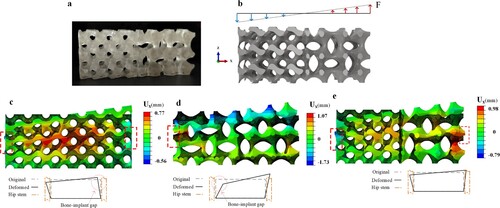
Figure 19. Hip stem implantation: (a) implant and bone assembly, (b) local enlargement of hip joint stem deformation.
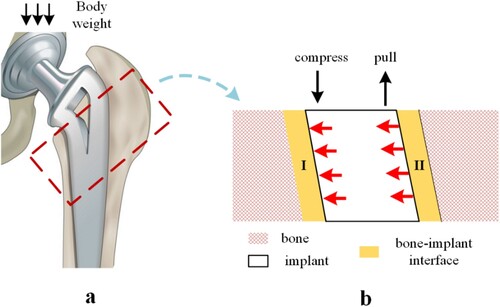
Figure 20. The design method of heterostructure with positive and negative Poisson’s ratio in the hip stem: (a) the hip stem with heterostructure, (b) the sigmoid function with structure G and P-QA, (c) cross-sectional deformation of heterostructure, and (d) the result of the heterostructure.
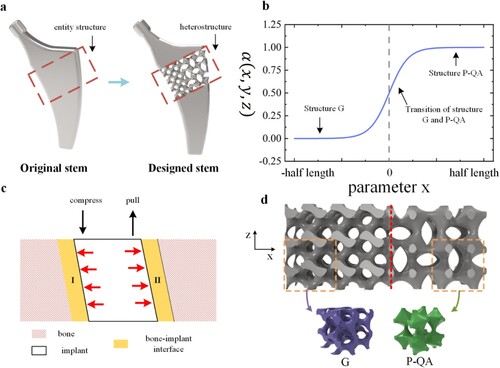
Figure 21. The properties of the heterostructure: (a) printed sample of the structure, (b) stress condition of the structure, (c) FEA results of the P-QA structure, (d) FEA results of the G structure, and (e) FEA results of the heterostructure.