
Figures & data
Figure 1. The morphologies captured by SEM and particle size distribution of: (a) 420SS powders, (b) Stellite 6 powders, (c) 17-4PH powders, (d) 18Ni300 powders.
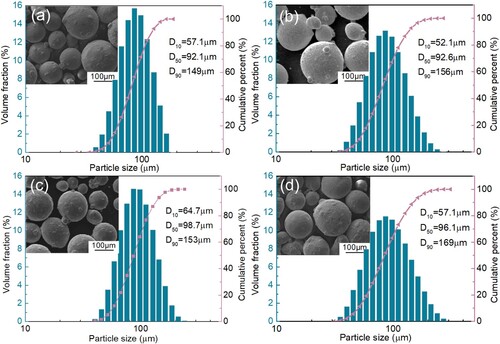
Table 1. Chemical composition of bainitic crossing nose (Wt.%).
Table 2. Chemical composition of depositing materials (Wt.%).
Table 3. Experimental parameters for depositing different materials by L-DED.
Figure 2. Sampling schematic (a, c) and final dimensions (b, d) of different specimens: (a, b) metallographic and mechanical properties specimens, (c, d) rolling-sliding specimens.
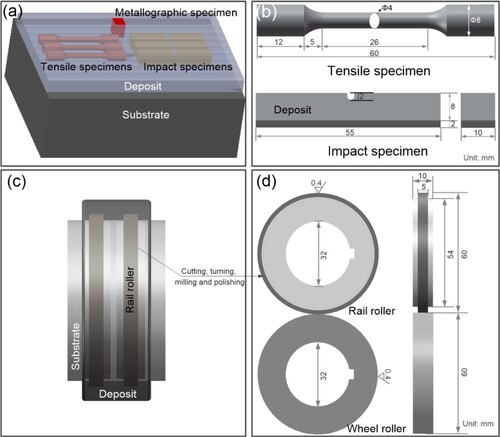
Figure 3. Microstructural characteristics of the 420SS deposit: (a) SEM picture, (b) Inverse pole figure (IPF) colour map with grain boundaries (GB, ≥ 10°), (c) Phase distribution picture, (d) GND map, (e) EDS mapping analysis of nanoprecipitates.
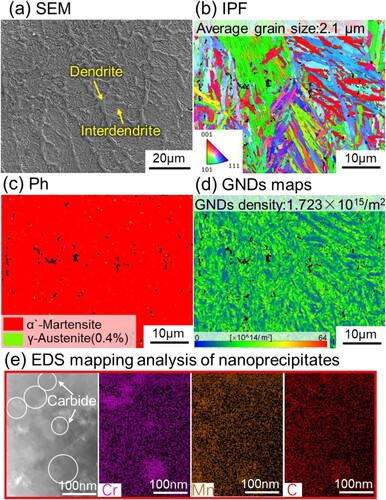
Figure 4. Microstructural characteristics of the Stellite 6 deposit: (a) SEM picture, (b) IPF colour map with GB (≥10°), (c) GND map, (d) Phase distribution picture and the element distribution of Co and Cr.
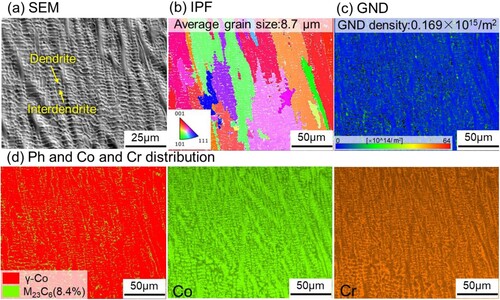
Figure 5. Microstructural characteristics of the 17-4PH deposit: (a) SEM picture, (b) IPF colour map with GB (≥10°), (c) GND map, (d) Band contrast and phase distribution picture with GB (≥ 10°) and the element distribution of Cr and Ni, (e) EDS mapping analysis of nanoprecipitates.
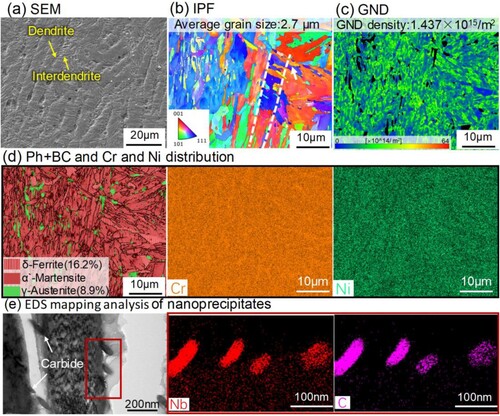
Figure 6. Microstructural characteristics of the 18Ni300 deposit: (a) SEM picture, (b) IPF colour map with GB (≥10°), (c) GND map, (d) Phase distribution picture and corresponding element distributions, (e) EDS mapping analysis of nanoprecipitates.
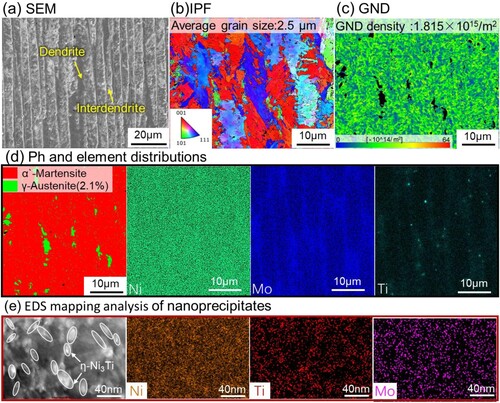
Figure 7. Microstructural characteristics of the untreated bainitic crossing nose: (a, b) SEM pictures, (c) IPF colour map with GB (≥10°), (d) Band contrast map overlapped with retained austenite (in green), (e) Bright field TEM picture.
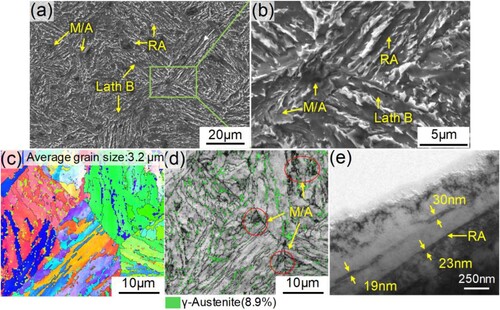
Figure 8. Microhardness distributions along the depth direction of different repaired bainitic crossing noses.
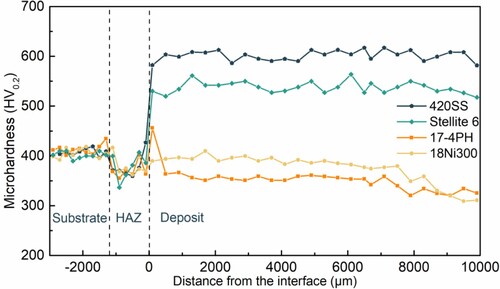
Figure 9. Tensile and impact properties of different deposits and untreated crossing noses.
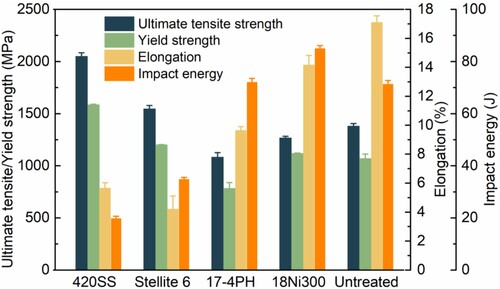
Figure 10. Tensile fracture surfaces of different specimens: (a–d) 420SS, Stellite 6, 17-4PH and 18Ni300 deposits, (e) untreated crossing nose, in which the (a1–e1) graphs are the full views of the corresponding tensile fracture surfaces.
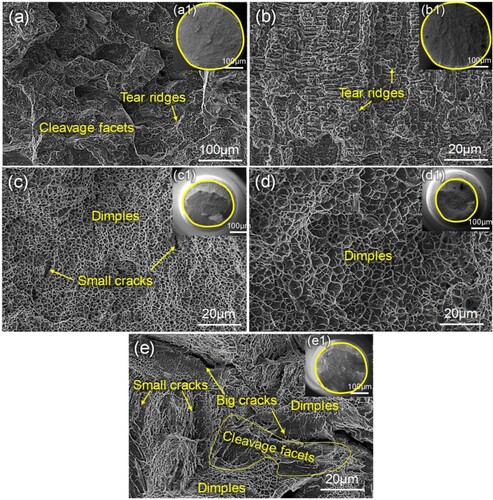
Figure 11. Mass wear rate of deposited and untreated rail rollers.
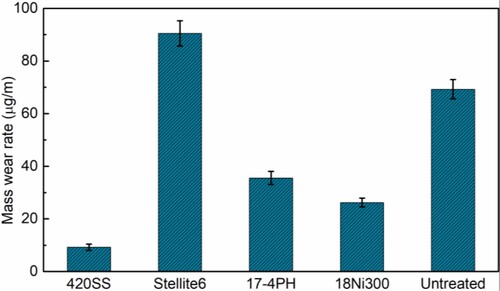
Figure 12. The plastic deformation morphologies and corresponding microhardness distributions of deposited rail rollers with: (a) 420SS, (b) Stellite 6, (c) 17-4PH and (d) 18Ni300 deposits, and untreated rail rollers (e).
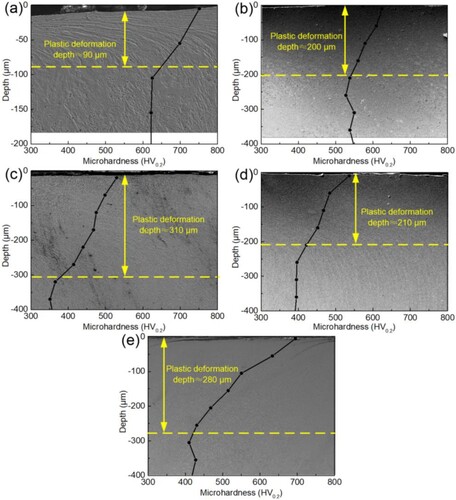
Figure 13. The cracks propagation morphologies of deposited rail rollers with: (a) 420SS, (b) Stellite 6, (c) 17-4PH and (d) 18Ni300 deposits, and untreated rail rollers (e).
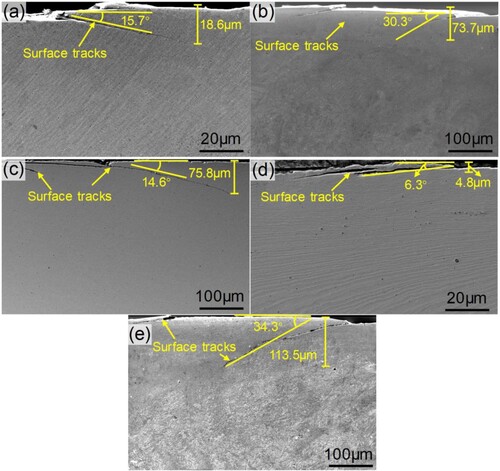
Table 4. Solid solution strengthening constant and EDS analyses results of chemical composition in different deposits (at.%).
Table 5. Measured yield strength and predicted results of 420SS, 17-4PH and 18Ni300 specimens.
Figure 14. The schematic diagram of microstructure and crack propagation behaviours in response to the impact load of: (a) 420SS, (b) Stellite 6, (c) 17-4PH, (d) 18Ni300 deposits, and (e) untreated crossing nose.
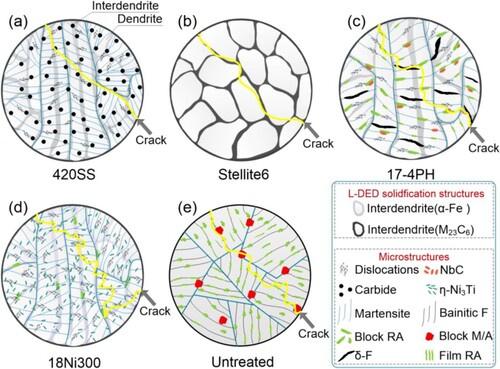
Figure 15. Comparison microhardness increment of deposited and untreated rail rollers before and after the tests.
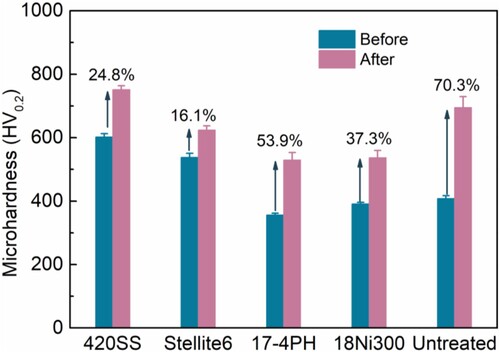
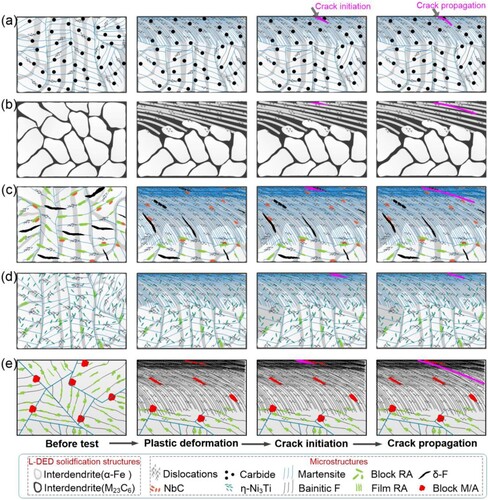
Figure 16. Schematic diagram of RCF crack initiation and propagation of deposited rail rollers with: (a) 420SS, (b) Stellite 6, (c) 17-4PH and (d) 18Ni300 deposits, and untreated rail rollers (e).
Data availability statement
The raw data required to reproduce these findings cannot be shared at this time as the data also forms part of an ongoing study.