
Figures & data
Figure 1. SEM image showing (a) the surface morphologies and (b,c) the cross-sectioned morphologies of pre-alloyed Al–5Mg2Si–2Mg–2Fe powder; (d) schematic diagram of laser beam scanning procedure; (e) optical micrograph showing the tensile samples and square samples; (f) XRD spectra of the Al–5Mg2Si–2Mg–2Fe alloy under as-LPBFed and as-aged conditions.
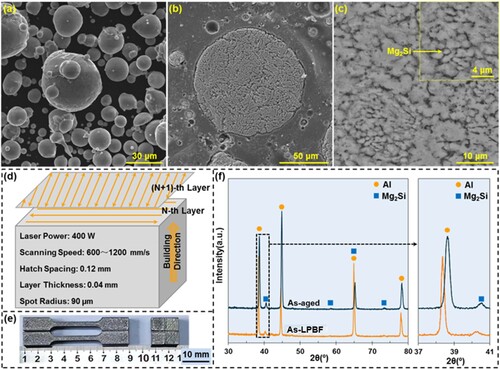
Table 1. The composition of experimental Al–5Mg2Si–2Mg–2Fe powder calibrated by ICP-AES.
Figure 2. (a–d) SEM and (e,f) TEM images showing the microstructure of as-LPBFed Al–5Mg2Si–2Mg–2Fe alloy; (a) the overall microstructure; (b,c) the detailed microstructure in zone L1 and zone L2, respectively; (d) the overall microstructure after deep etching; (e) BF-TEM image showing the detailed microstructure in zone L1; (f) STEM image displaying the detailed microstructure in zone L2.
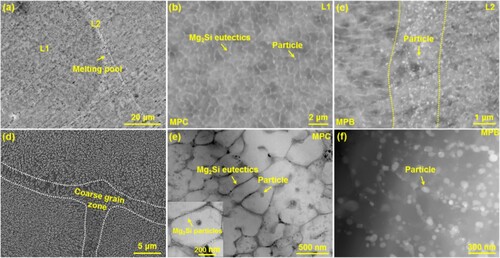
Figure 3. Details of TEM analysis of microstructure of the as-LPBFed Al–5Mg2Si–2Mg–2Fe alloy: (a–d) the interface relationships between Al matrix and Mg2Si as well as white particles; (e, e1–e5; f, f1–f5) showing the elemental mapping of the cells and MPB zone where particle enriches, respectively.
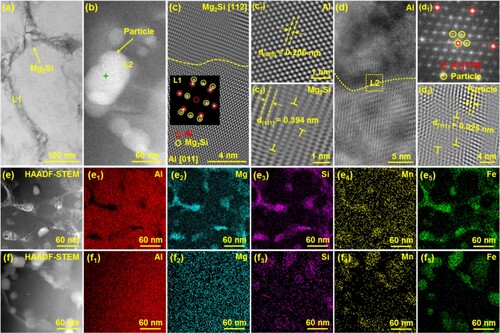
Table 2. Average compositions (wt.%) of the different regions measured by quantitative TEM/EDX analysis (b and Figure S2) in the as-LPBFed Al–5Mg2Si–2Mg–2Fe alloy.
Figure 4. SEM/TEM images showing the as-LPBFed Al–5Mg2Si–2Mg–2Fe alloy with ageing at 180°C for 3.5 h; (a,d,e) the overall microstructure; the detailed microstructure in zone L1 (b) and zone L2 (c); (f) the formation of in-situ Mg2Si particles with eutectic network; (g) the formation of low number density of α-Al12(Fe,Mn)3Si particle at the MPC zone.
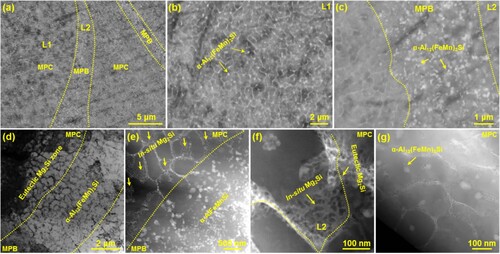
Figure 5. Detailed TEM analysis of as-LPBFed Al–5Mg2Si–2Mg–2Fe alloy with ageing at 180°C for 3.5 h; (a,b,L1,L2) the formation of Mg2Si particles within Mg2Si eutectics; (c) the formation of high number density α-Al12(Fe,Mn)3Si particle at the MPB zone; (d, d1–d5) EDS maps of Mg2Si eutectics; (e, e1–e5) EDS maps of in-situ Mg2Si particles; (f, f1–f5) EDS maps of α-Al12(Fe,Mn)3Si particles distributed at MPB zone.
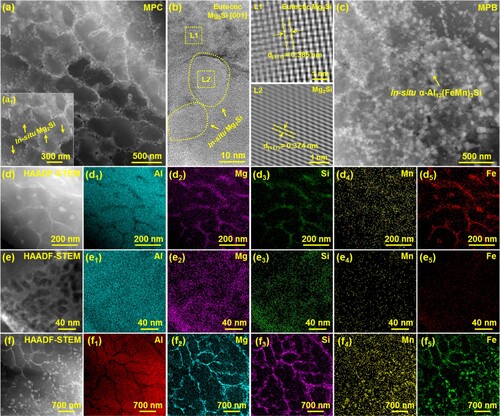
Figure 6. EBSD-inverse pole figures (IPFs) of the as-LPBFed Al-5Mg2Si-2Mg-2Fe alloy along (a) horizontal and (b) building directions; (c) schematic images showing the direction of samples; (d) corresponding IPF map.
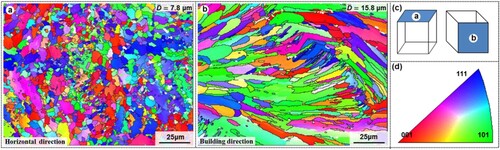
Figure 7. (a) Equilibrium phase diagram of Al–Mg2Si and Al–5Mg2Si–2Mg alloy; (b) vertical cross-section of Al–5Mg2Si–2Mg–xFe alloy; (c) the crack susceptibility index (CSI) calculated via T vs. (fs)1/2 curves of Al–5Mg2Si–2Mg–xFe alloy; (d) Scheil solidification simulation of the Al–5Mg2Si–2Mg–2.2Fe–0.8Mn alloy.
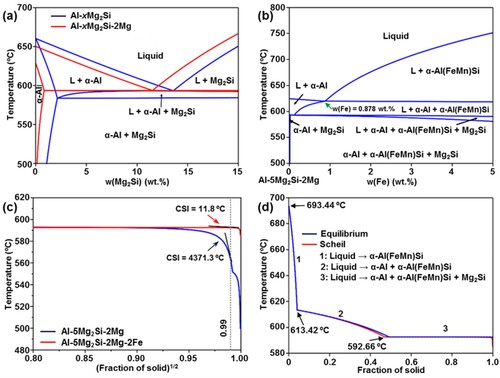
Figure 8. The effects of high SV on (a) the solidification path (b) the Fe solubility in α-Al considering the α-Al phase as the primary phase.
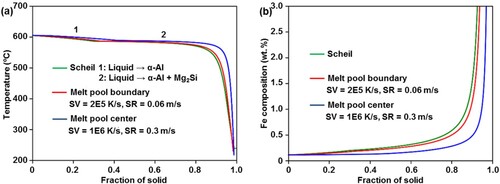
Table 3. Kinetic parameters for the Al–5Mg2Si–2Mg–2Fe alloy.
Figure 9. (a) Tensile stress-strain curves of the Al–5Mg2Si–2Mg–2Fe alloy without and with ageing treatment; (b,c) tensile fractured morphology; (d) comparison of the tensile properties between the Al–5Mg2Si–2Mg–2Fe alloy in this study and other Al alloys fabricated by casting, LPBF and HPDC methods.
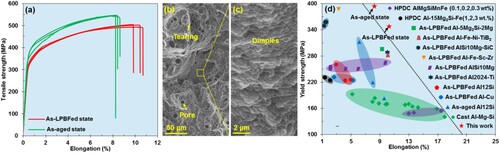
Figure 10. TEM analysis of the (a,b) as-LPBFed and (c,d) as-aged Al–5Mg2Si–2Mg–2Fe alloy after tensile testing: (a) the interaction between dislocations and Mg2Si eutectics at the MPC zone; (c) the interaction between dislocations and Mg2Si eutectics and in-situ Mg2Si particles at the MPC zone; (b,d) The interaction between dislocations and α-Al12(Fe,Mn)3Si particles at the MPB zone.
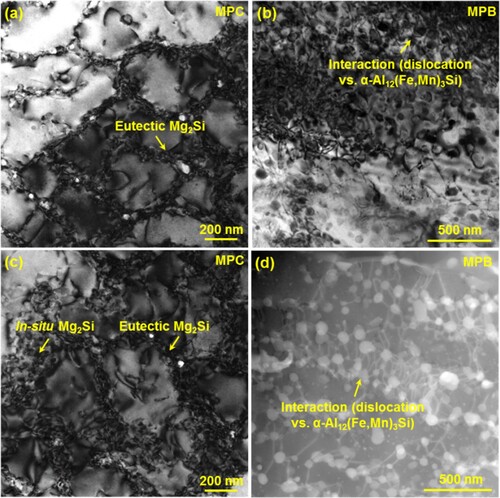
Figure 11. The contributions of different strengthening mechanisms to the YS.
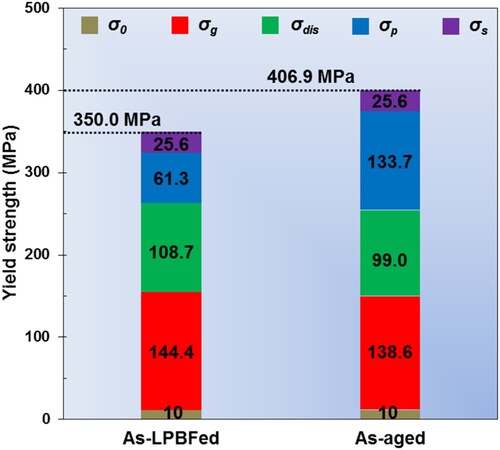
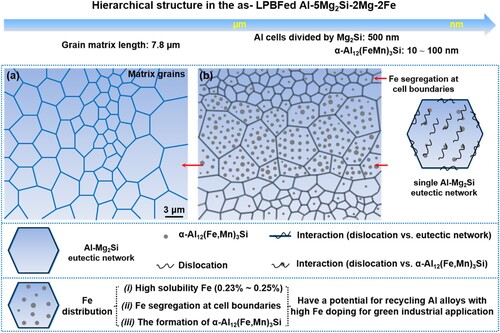
Figure 12. Schematic image showing the microstructural characteristics in this work.
Supplemental Material
Download MS Word (2.2 MB)Data availability statement
The data that support the findings of this study are available from the corresponding author upon reasonable request.