Figures & data
Table 1. Advantages and disadvantages of different AM technologies [Citation38].
Figure 1. Schematic diagram of the processing principle of DED.
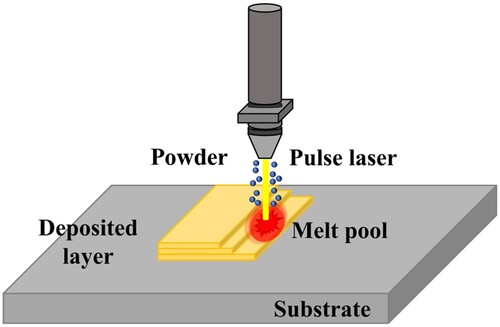
Figure 2. Classification of the major DED technologies. Adapted from Dass and Moridi [Citation45].
![Figure 2. Classification of the major DED technologies. Adapted from Dass and Moridi [Citation45].](/cms/asset/b4329c81-9bb2-43ed-b97d-8b6cc6869797/nvpp_a_2266658_f0002_oc.jpg)
Figure 3. Schematic diagram of SLM processing principle.
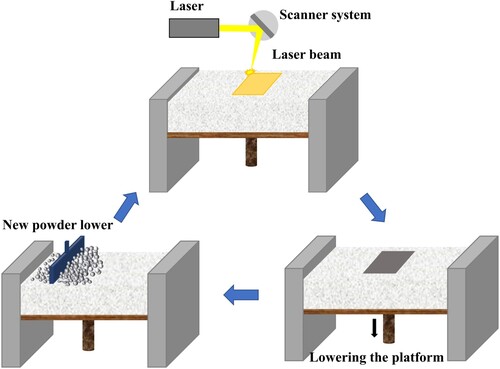
Figure 4. Schematic diagram of EBM processing principle.
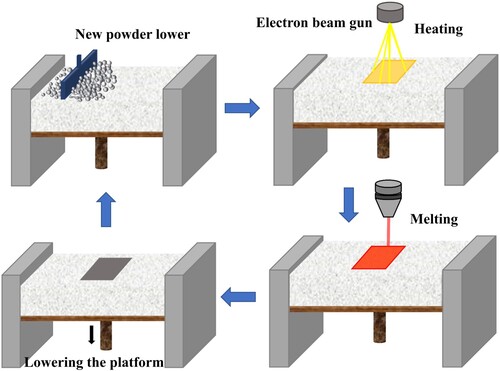
Figure 5. Classification of the major PBF technologies.
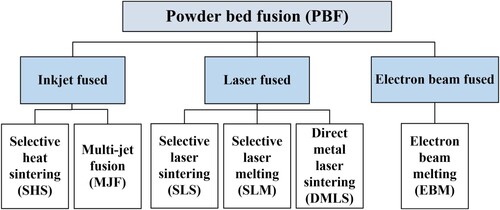
Figure 6. Some typical defects in a metal AM part [Citation15].
![Figure 6. Some typical defects in a metal AM part [Citation15].](/cms/asset/f865076d-666d-407e-b2d1-a7463c5ebfe7/nvpp_a_2266658_f0006_ob.jpg)
Figure 7. Establishing the correlation between microstructure, mechanical properties and the performance of the component through NDT in AM.
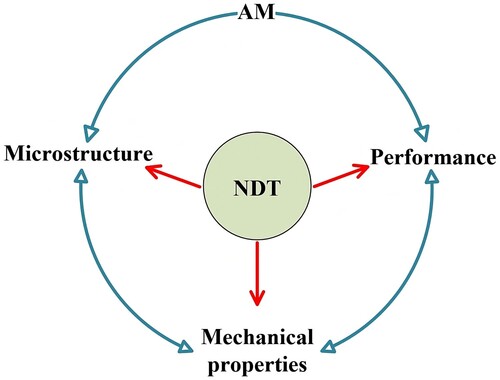
Table 2. Analysis of state-of-the-art NDT techniques [Citation22, Citation66].
Figure 8. Schematic of selective laser melting (SLM) process monitoring system [Citation67].
![Figure 8. Schematic of selective laser melting (SLM) process monitoring system [Citation67].](/cms/asset/22eaceef-9af2-4a4b-be25-1aeaf2f65086/nvpp_a_2266658_f0008_oc.jpg)
Figure 9. The elements of X-ray CT system, including X-ray source, detectors, test object, and reconstruction algorithms. Adapted from Biswal et al. [Citation74] and Ramírez et al. [Citation15].
![Figure 9. The elements of X-ray CT system, including X-ray source, detectors, test object, and reconstruction algorithms. Adapted from Biswal et al. [Citation74] and Ramírez et al. [Citation15].](/cms/asset/f558ff06-f3d7-4184-8e53-60ebc973c98a/nvpp_a_2266658_f0009_oc.jpg)
Figure 10. Synchrotron X-ray CT of the L-PBF 316L stainless steel cylinders (grey) and defects (red) using different laser power: (a) 380 W, (b) 320 W, (c) 260 W, and (d) 200 W [Citation90].
![Figure 10. Synchrotron X-ray CT of the L-PBF 316L stainless steel cylinders (grey) and defects (red) using different laser power: (a) 380 W, (b) 320 W, (c) 260 W, and (d) 200 W [Citation90].](/cms/asset/e1fffb15-a15f-4d6e-907e-9b8979906370/nvpp_a_2266658_f0010_oc.jpg)
Figure 11. Schematic illustration of acoustic emission (AE) testing procedure for internal defect detection.
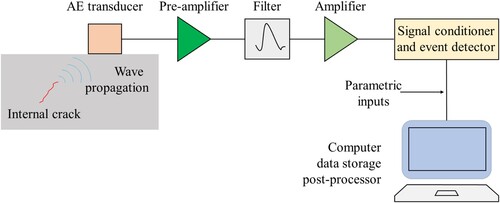
Figure 12. Test bench setup for AE during L-PBF [Citation96].
![Figure 12. Test bench setup for AE during L-PBF [Citation96].](/cms/asset/ae6e9231-3b04-4d8b-ac85-c61c35055eea/nvpp_a_2266658_f0012_oc.jpg)
Figure 13. (a) Arc-DED manufacturing process and (b) ultrasonic phased array inspection using (c) the total focusing method (TFM). Adapted from Javadi et al. [Citation117].
![Figure 13. (a) Arc-DED manufacturing process and (b) ultrasonic phased array inspection using (c) the total focusing method (TFM). Adapted from Javadi et al. [Citation117].](/cms/asset/79da4c25-3d1e-4b7f-ad63-575cef854e40/nvpp_a_2266658_f0013_oc.jpg)
Figure 14. (a) Experimental setup for ultrasonic phased array testing. Elastic least-squares RTM images of (b) longitudinal wave velocity, (c) shear wave velocity, and (d) density in the multi-material part of the experiment. Adapted from Rao et al. [Citation119].
![Figure 14. (a) Experimental setup for ultrasonic phased array testing. Elastic least-squares RTM images of (b) longitudinal wave velocity, (c) shear wave velocity, and (d) density in the multi-material part of the experiment. Adapted from Rao et al. [Citation119].](/cms/asset/acd16c1a-189b-4b40-bac5-2da85ea74574/nvpp_a_2266658_f0014_oc.jpg)
Figure 15. (a) Laser ultrasonic imaging system and (b) schematics of 3D imaging of subsurface defects [Citation121]. Note that DAQ and LDV stand for the high-speed data acquisition and laser Doppler vibrometer, respectively.
![Figure 15. (a) Laser ultrasonic imaging system and (b) schematics of 3D imaging of subsurface defects [Citation121]. Note that DAQ and LDV stand for the high-speed data acquisition and laser Doppler vibrometer, respectively.](/cms/asset/d3e8a23f-9ae1-4bac-ae4e-a1098732ad1a/nvpp_a_2266658_f0015_oc.jpg)
Figure 16. Schematic illustration of a typical reflection test setup of active infrared thermography.
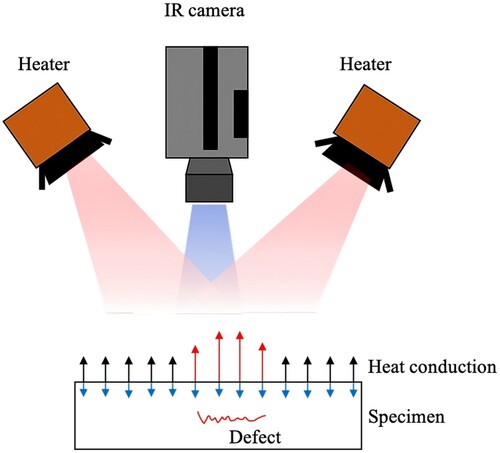
Figure 17. Thermograms of the PBF specimen made of the Inconel 718. (a) Front view and (b) rear view [Citation145]. Note that black circles indicate defect outlines.
![Figure 17. Thermograms of the PBF specimen made of the Inconel 718. (a) Front view and (b) rear view [Citation145]. Note that black circles indicate defect outlines.](/cms/asset/a67cdcae-eed3-48a4-b266-baa208363499/nvpp_a_2266658_f0017_ob.jpg)
Figure 18. Types of machine learning based on input data used to train the algorithm. Note that MLP, CNN and RNN stand for multilayer perceptrons, convolutional neural network and recurrent neural network, respectively.
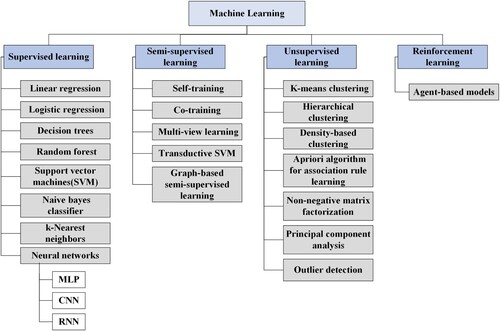
Figure 19. (a–d) Optical images of laser metal deposition build metal parts and (e–h) corresponding attention maps [Citation149]. Note that defects are marked in red circles and rectangles.
![Figure 19. (a–d) Optical images of laser metal deposition build metal parts and (e–h) corresponding attention maps [Citation149]. Note that defects are marked in red circles and rectangles.](/cms/asset/26791b55-f7d8-487e-af00-ca4735056ee3/nvpp_a_2266658_f0019_oc.jpg)
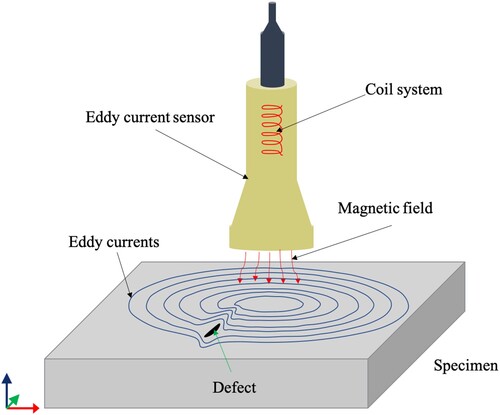
Figure 20. Principle of eddy current testing.