
Figures & data
Figure 1. Schematic illustration of the relation of print resolution and centre-to-centre droplet distance in inkjet printing.
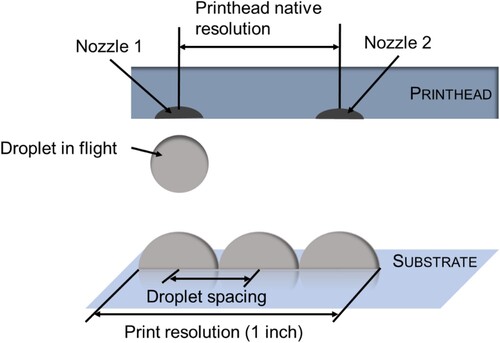
Figure 2. 3D inkjet printer by Notion Systems: n.jet 3D high laydown.
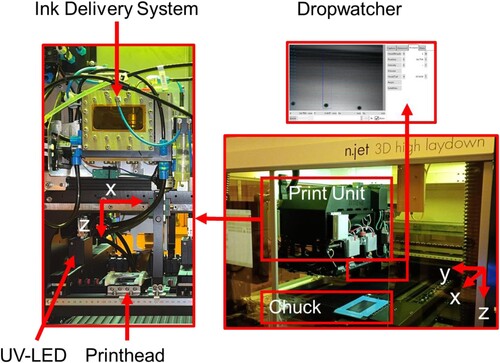
Table 1. Examined printing parameters.
Table 2. Overview of the printing trials designed based on the central composite design.
Figure 3. CAD-model of the test specimen (1000 mm × 700 mm) (a) and examples of (b) TIFF-Images for layer number 1–20, coverage percentage 90% and (c) layer number 21–40, coverage percentage 90%.
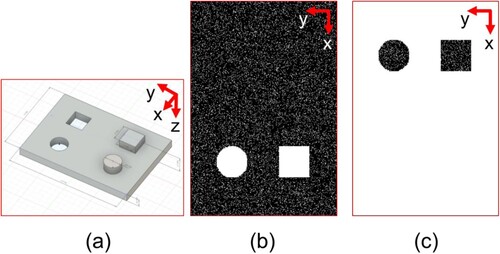
Figure 4. Average printed layer height (n = 2) of samples printed at various printing conditions and images of the specimens of the print trials #32 and #48 with the largest and lowest layer thickness (corresponding data points marked with a red dotted circle).
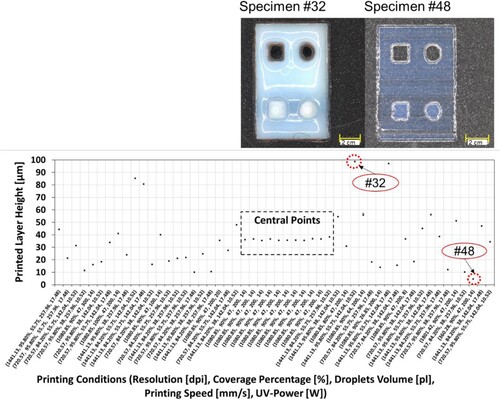
Table 3. Corresponding print settings and measured layer thickness of the printed samples (CP = central Points). Table entries are listed in correspondence to the order in (first row equals to the left data point on the x-axis).
Figure 5. Effect of each parameter (normalised value) on the printed layer height.
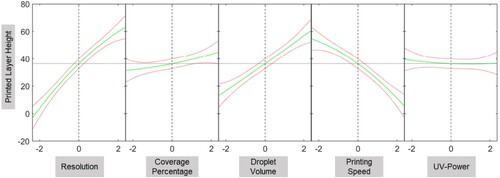
Figure 6. Effect of print resolution on printed layer height (n = 2) and images of the specimens of the print trials #27 and #16 (corresponding data points marked with a red dotted circle, for detailed parameter values see ).
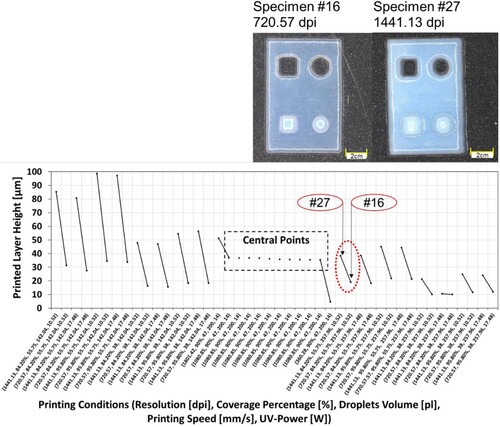
Figure 7. Effect of coverage percentage on layer height (n = 2) and images of the specimens of the print trials #5 and #47 (corresponding data points marked with a red dotted circle, for detailed parameter values see ).
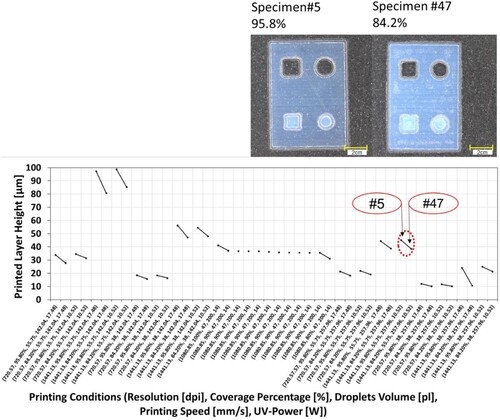
Figure 8. Effect of droplet volume on layer height (n = 2) and images of the specimens of the print trials #32 and #28 (corresponding data points marked with a red dotted circle, for detailed parameter values see ).
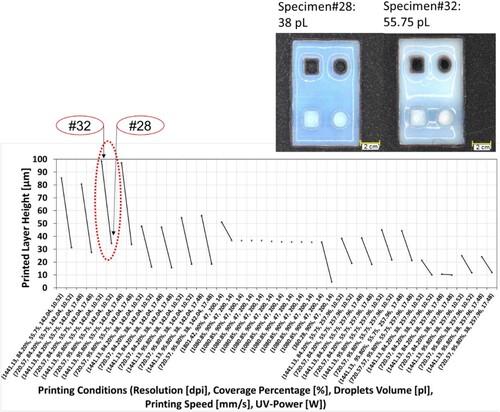
Figure 9. Effect of printing speed on layer height (n = 2) and images of the specimens of the print trials #25 and #17 (corresponding data points marked with a red dotted circle, for detailed parameter values see ).
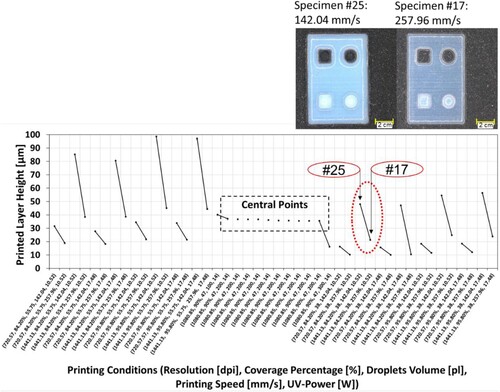
Figure 10. Effect of UV-Power on layer height (n = 2) and images of the specimens of the print trials #37 and #32 (corresponding data points marked with a red dotted circle, for detailed parameter values see ).
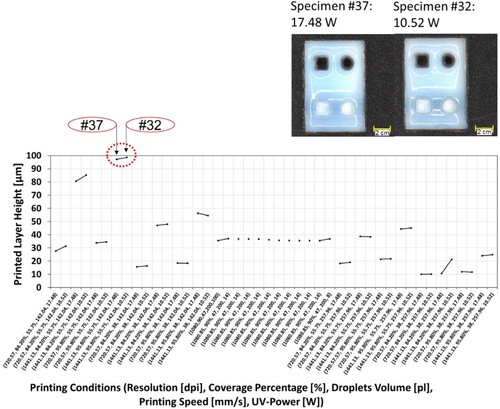
Figure 11. Effect of interaction of printing parameters on printed layer height.
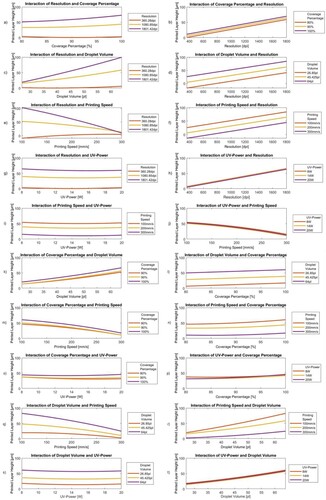
Figure 12. Two droplets coalesce while creating a liquid bridge.
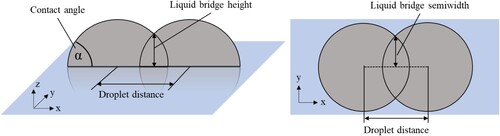
Figure 13. TIFF image input and resulted printed squared pattern (size 10 mm × 10 mm, 1 layer) with 50% and 100% coverage percentages printed with a resolution of 360 dpi.
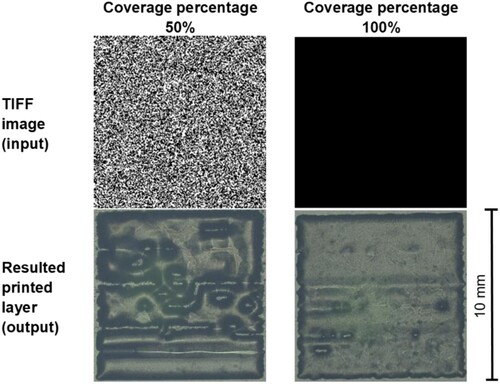
Figure 14. Diameter of droplets on PET-substrate with a droplet volume of (a) 64 pl, average droplet diameter 133.67 µm; and (b) 26.85 pl, average droplet diameter 87 µm.
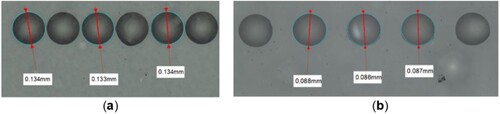
Figure 15. Comparison of samples printed at different printing speeds; (a) TIFF-Image, size 10 mm × 10 mm, (b) sample printed at printing speed 100 mm/s, (c) sample printed at printing speed 300 mm/s.
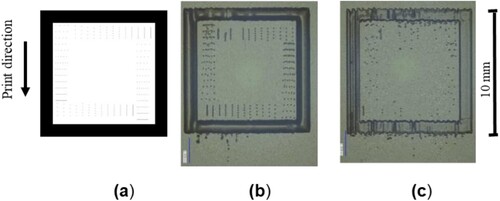
Table 4. Corresponding print frequencies of this study at various print velocities and print resolution.