
Figures & data
Figure 1. Modelling of the transmittance based on the Lambert–Beer–Bourguer law, using τp as measured via FTIR.
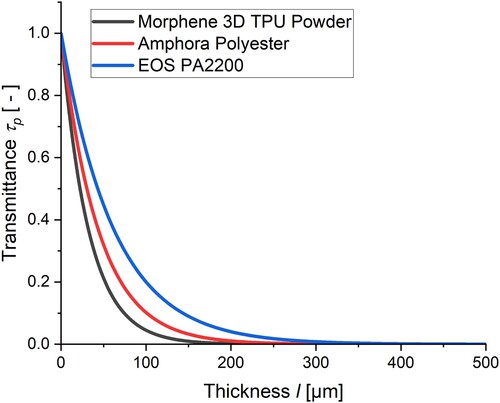
Table 1. Experimental SLS parameter settings.
Figure 2. (a) Comparison between 2D-calculations (black dots) as a function of the scan spacing (S), the 2nd degree polynomial fitting in the present work (green; Equation (14)) and the model outcome proposed by Pilipović et al. [Citation39,Citation40] (red line), (b) areas considered upon calculating the overlay factor through integrals, showing the main laser scan (grey) and the two adjacent laser scans (blue and red) in case S = 0.15 mm, (c) areas considered upon calculating the overlay factor in case S = 0.30 mm and (d) areas considered upon calculating the overlay factor in case S = 0.10 mm.
![Figure 2. (a) Comparison between 2D-calculations (black dots) as a function of the scan spacing (S), the 2nd degree polynomial fitting in the present work (green; Equation (14)) and the model outcome proposed by Pilipović et al. [Citation39,Citation40] (red line), (b) areas considered upon calculating the overlay factor through integrals, showing the main laser scan (grey) and the two adjacent laser scans (blue and red) in case S = 0.15 mm, (c) areas considered upon calculating the overlay factor in case S = 0.30 mm and (d) areas considered upon calculating the overlay factor in case S = 0.10 mm.](/cms/asset/1803ba82-a947-4807-9d56-383c77f0ce6a/nvpp_a_2285414_f0002_oc.jpg)
Figure 3. Specific heat capacity value versus temperature for the determination of Cp,solid,avg [Tambient,Tpreheat].
![Figure 3. Specific heat capacity value versus temperature for the determination of Cp,solid,avg [Tambient,Tpreheat].](/cms/asset/f401acfa-afc9-42aa-9822-589ea7a8db50/nvpp_a_2285414_f0003_ob.jpg)
Figure 4. PSD frequency (left axis) and cumulative frequency (right axis), Davg and D50 calculated for the whole range of particle diameters and the common interval [20,100] µm. Inset: optical image of PA2200 used in this research.
![Figure 4. PSD frequency (left axis) and cumulative frequency (right axis), Davg and D50 calculated for the whole range of particle diameters and the common interval [20,100] µm. Inset: optical image of PA2200 used in this research.](/cms/asset/d9b9215f-6fc6-41fc-8c4c-2f84e16238d5/nvpp_a_2285414_f0004_oc.jpg)
Figure 5. (a) Whiteness index (black) and yellowness index (red) as a function of the volume energy density (EDvol; Equation (17)). (b) Density as a function of the volume energy density for PA. A critical EDvol value of 1.58 J·mm−3 is identified.
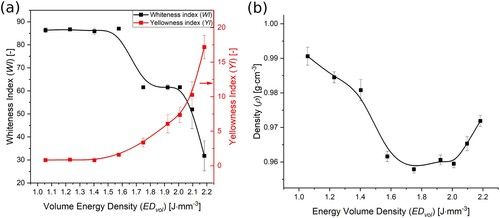
Figure 6. SEM images of cryogenically broken samples obtained with different settings of laser power P. (a) P = 10 W, (b) P = 12 W, (c) P = 14 W, (d) P = 16 W and (e) P = 18 W. Red circles indicate holes formed due to degradation. Blue arrows indicate voids due to a non-uniform melt phase.
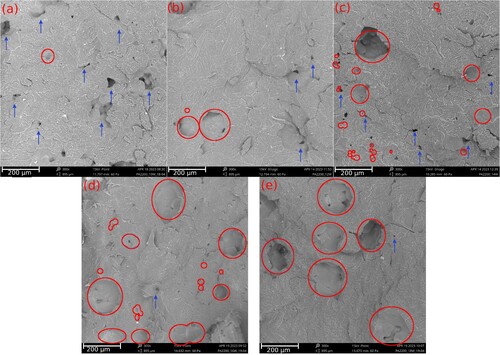
Figure 7. (a) Comparison of analytical model predictions by Vasquez et al. [Citation27] (black), Lupone et al. [Citation63] (red), Vande Ryse et al. [Citation31,Citation32] (blue) and the in this work proposed Equation (18) (green), including the experimentally noticed onset degradation based on the experimental results of and (purple) taking for simplicity a flat dashed line at 14 W. (b) Tensile modulus (grey) and flexural modulus (orange) of obtained PA printed samples with different settings for P (8, 14, 17, 19, 21 and 25 W), including as vertical lines the energy volume density (EDvol; Equation (17)) associated with the minimal laser power for degradation for the analytical models covered in subplot a.
![Figure 7. (a) Comparison of analytical model predictions by Vasquez et al. [Citation27] (black), Lupone et al. [Citation63] (red), Vande Ryse et al. [Citation31,Citation32] (blue) and the in this work proposed Equation (18) (green), including the experimentally noticed onset degradation based on the experimental results of Figures 5 and 6 (purple) taking for simplicity a flat dashed line at 14 W. (b) Tensile modulus (grey) and flexural modulus (orange) of obtained PA printed samples with different settings for P (8, 14, 17, 19, 21 and 25 W), including as vertical lines the energy volume density (EDvol; Equation (17)) associated with the minimal laser power for degradation for the analytical models covered in subplot a.](/cms/asset/0735c522-9968-4225-82f9-4281894c4018/nvpp_a_2285414_f0007_oc.jpg)
Figure 8. Further comparison of the models of Vasquez et al. [Citation27] (black), Lupone et al. [Citation63] (red), Vande Ryse et al. [Citation32] (blue) and the proposed Equation (18) (green; bars on top also the actual value) for PA and two other polymers (TPC (middle) and TPU (right)) including the laser power at which degradation was noticed experimentally (grey square and value in grey in blue bar). Models evaluated for the experimental average particle size. Model parameters in the Supporting Information (see Tables S1–Table S4).
![Figure 8. Further comparison of the models of Vasquez et al. [Citation27] (black), Lupone et al. [Citation63] (red), Vande Ryse et al. [Citation32] (blue) and the proposed Equation (18) (green; bars on top also the actual value) for PA and two other polymers (TPC (middle) and TPU (right)) including the laser power at which degradation was noticed experimentally (grey square and value in grey in blue bar). Models evaluated for the experimental average particle size. Model parameters in the Supporting Information (see Tables S1–Table S4).](/cms/asset/0d15fd1d-8974-4b1e-9b21-a5482b7ef836/nvpp_a_2285414_f0008_oc.jpg)