
Figures & data
Figure 1. Deposition system with laser scanner.
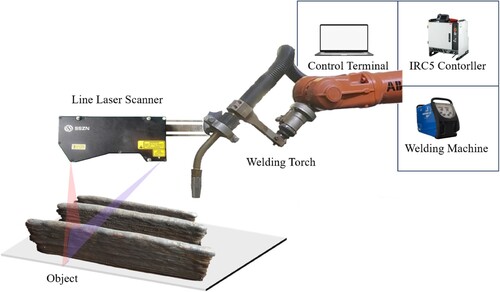
Table 1. Line-laser scanner parameters.
Figure 2. Defect detection objective.
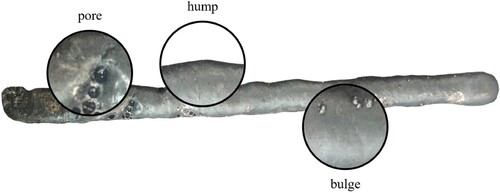
Figure 3. Processes of defect detection and evaluation system.
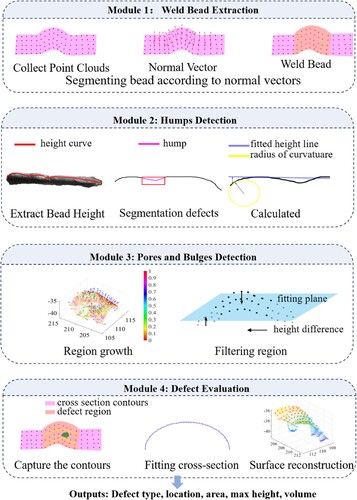
Figure 4. The curvature and normal vector of the point cloud; (a) 3D point cloud; (b) normal vector of point cloud; (c) curvature of the point cloud.
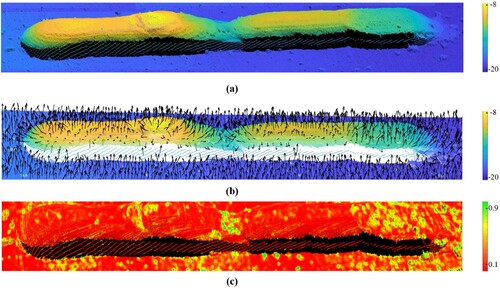
Figure 5. Weld bead extraction process, (a) normal vector Z-component two-dimensional graph; (b) segmentation threshold of 240; (c) closed operation; (d) extracted weld bead contour; (e) removal of noise around the contour based on contour area; (f) opening and closing operation.
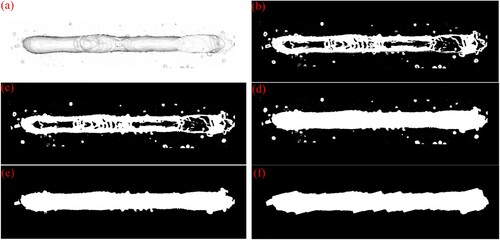
Figure 6. Extraction process of weld bead centreline; (a) result of morphological thinning; (b) the simplified centreline; (c) the centreline in the 3D point cloud.
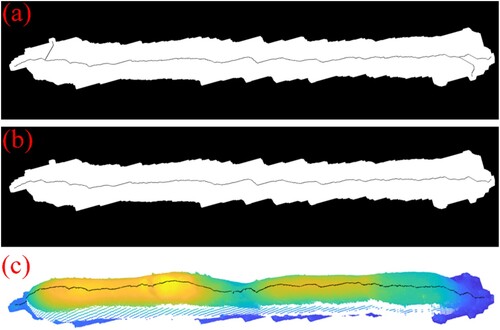
Table 2. RANSAC line fitting algorithm summary.
Figure 7. Humps defect detection; (a) image of weld bead; (b) the real height curve and RANSAC fitted line; (c) height difference; (d) curvature radius of the height curve; (e)the combined index; (f) result of hump detection.
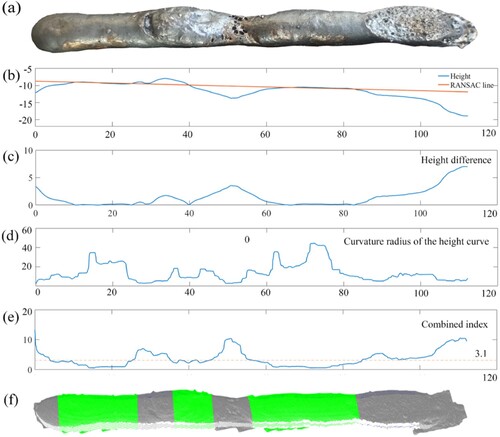
Figure 8. Detection failure case: (a) Triangular deposition; (b) Extracted centreline and actual centreline.
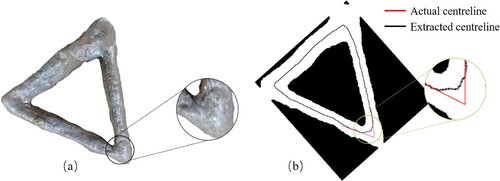
Figure 9. Regional growth segmentation and filtering region.
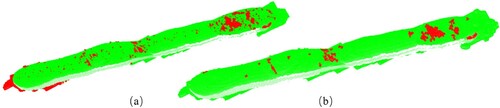
Figure 10. Defect evaluation process; (a) extraction of the weld bead cross-section; (b) polynomial fitting; (c) surface reconstruction of the defect.
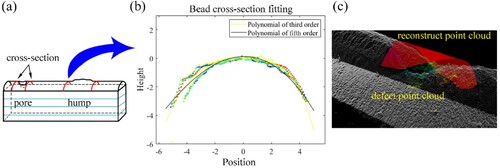
Figure 11. Test cases.
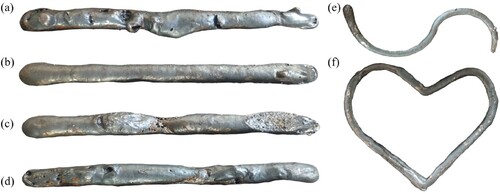
Figure 12. Result of weld extraction.
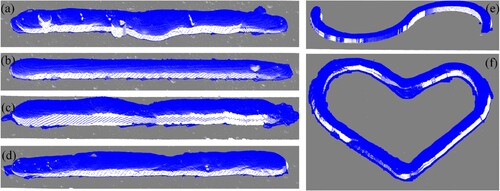
Figure 13. Result of defect detection.
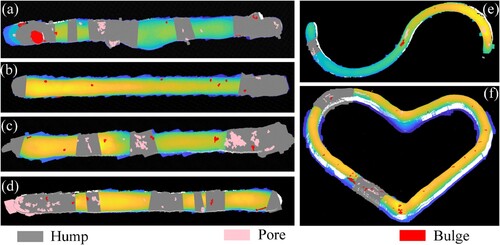
Figure 14. Detection results of interlayer accumulation; (b) The results of defect detection on the second layer; (c) The results of defect detection on the fourth layer; (d)The results of defect detection on the ninth layer.
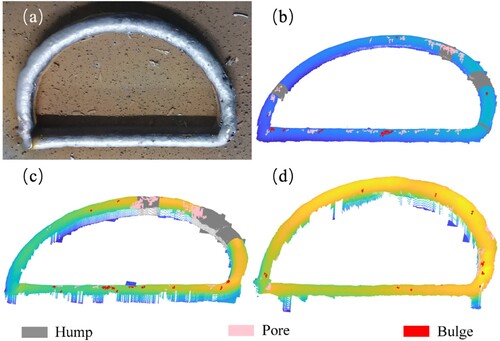
Table 3. Defect detection result.
Table 4. Time statistics of normal and curvature are calculated.
Figure 15. (a) After the first layer; (b) After the first bead of the second layer; (c) point cloud image of (a); (d) point cloud image of (b); (e) Overlapping of (a) and (b), blue for (a), red for (b); (f) Extracting the point cloud of current bead to be detected.
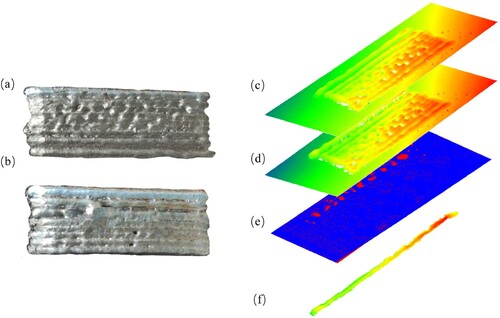
Table 5. Evaluation metrics of the algorithm.
Figure 16. Result of defect evaluation.
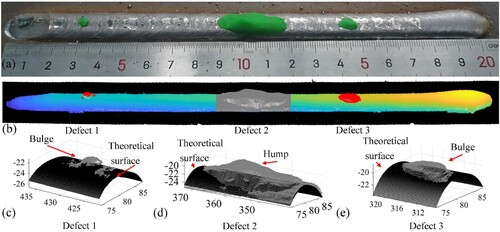
Table 6. Defect evaluation result.
Data availability statement
The data that support the findings of this study are openly available in Mendeley Data at doi: 10.17632/vm5rmhtxbx.1.